
FIG 2.
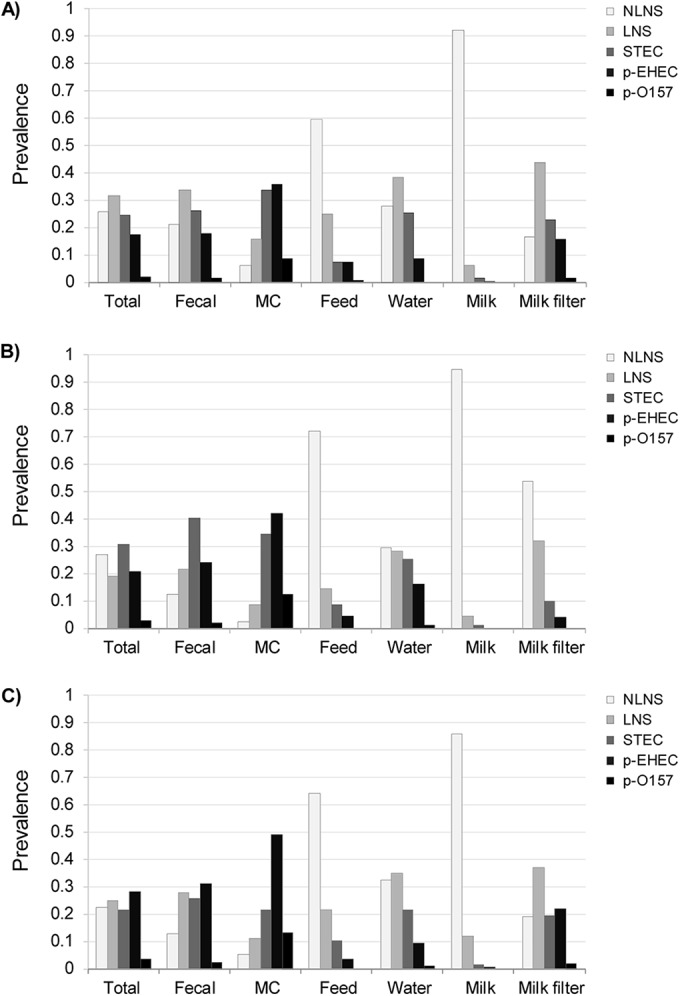
Relative abundance of whole-sample potential E. coli pathogenicity classes in dairy farm matrices. Data for farms A, B, and C are shown in panels A, B, and C, respectively. MC, manure composite.
Official websites use .gov
A
.gov website belongs to an official
government organization in the United States.
Secure .gov websites use HTTPS
A lock (
) or https:// means you've safely
connected to the .gov website. Share sensitive
information only on official, secure websites.
Relative abundance of whole-sample potential E. coli pathogenicity classes in dairy farm matrices. Data for farms A, B, and C are shown in panels A, B, and C, respectively. MC, manure composite.