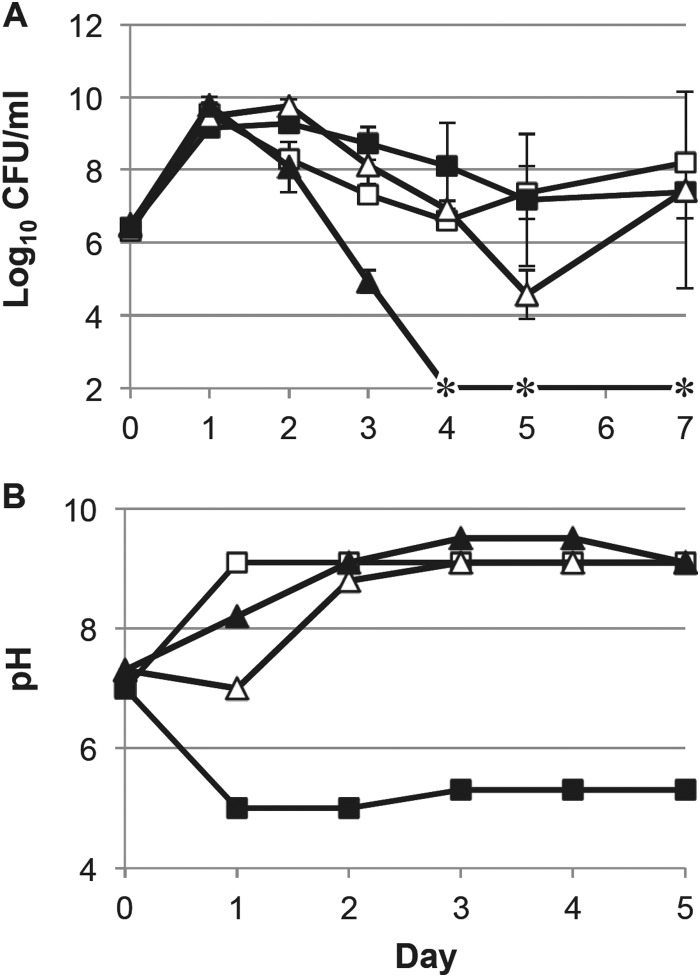
FIG 4.
Effect of glycerol on survival in LB and TB. (A) Viable counts of cells incubated in test tubes in LB (open squares), LB(+glycerol) (solid squares), TB (open triangles), and TB(−glycerol) (solid triangles). Averages from 6 replicates are shown. Error bars represent standard deviations. (B) pH of the same cultures shown in panel A. Asterisks indicate cell densities below the limit of detection (<1,000 CFU/ml).

