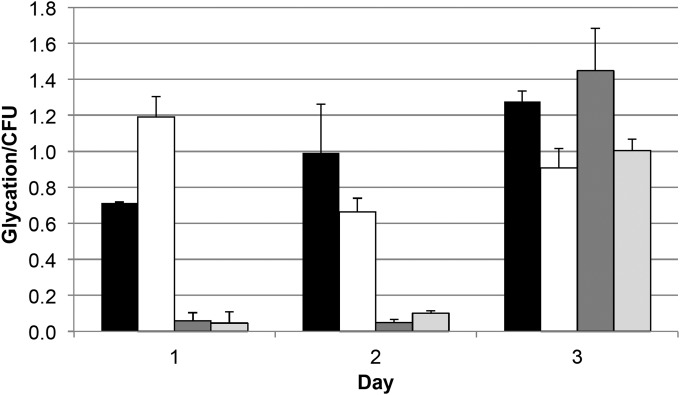
FIG 5.
Glycation levels in rich media. Shown is glycation per milligram of protein per CFU of total isolated protein from cells cultured in LB (black bars), YT (white bars), TB (dark gray bars), and SB (light gray bars). Data are the averages from two biological replicates; error bars represent standard deviations.

