FIG 5.
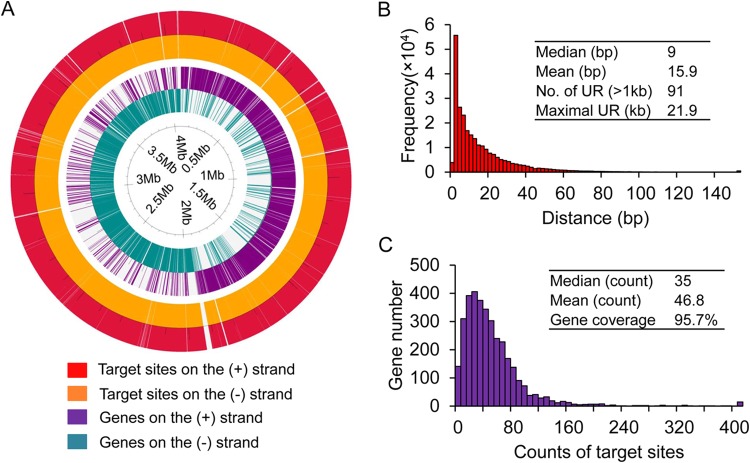
Bioinformatic analysis of targeting space in C. cellulolyticum. (A) Genome-wide distribution of genes and target sites on both DNA strands. White areas in each track indicate gaps between adjacent genes or target sites. The color code is given below the map. (B) Histogram of distance between adjacent usable target sites. Values of mean and median, the number of untouchable regions (UR) with lengths of >1 kb, and the length of the maximal UR are inset within the plot. (C) Histogram of the number of usable target sites in genes. The values of mean, median, and gene coverage are inset.

