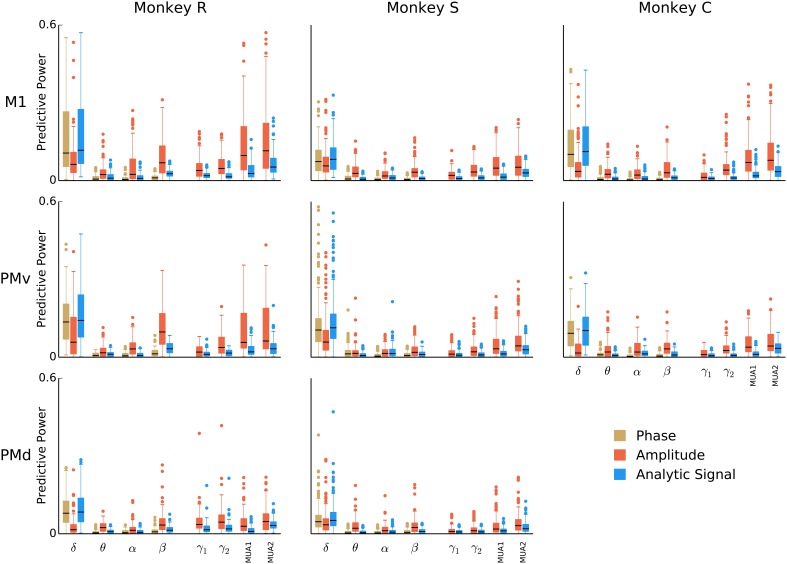
Figure 4.
Breakdown of LFP predictive power by frequency band and LFP feature. Box-plots over the population of isolated units (all sessions combined) showing the predictive power of models based on phase, amplitude, or analytic signal features in isolation from each of eight bands. To better assess the individual predictive power of each LFP feature, models were fitted for each feature separately. Certain features, such as the instantaneous phase and analytic signal for the 0.3–2 Hz band, as well as the analytic signal amplitude modulation above 100 Hz, consistently predict spiking across all animals and areas.

