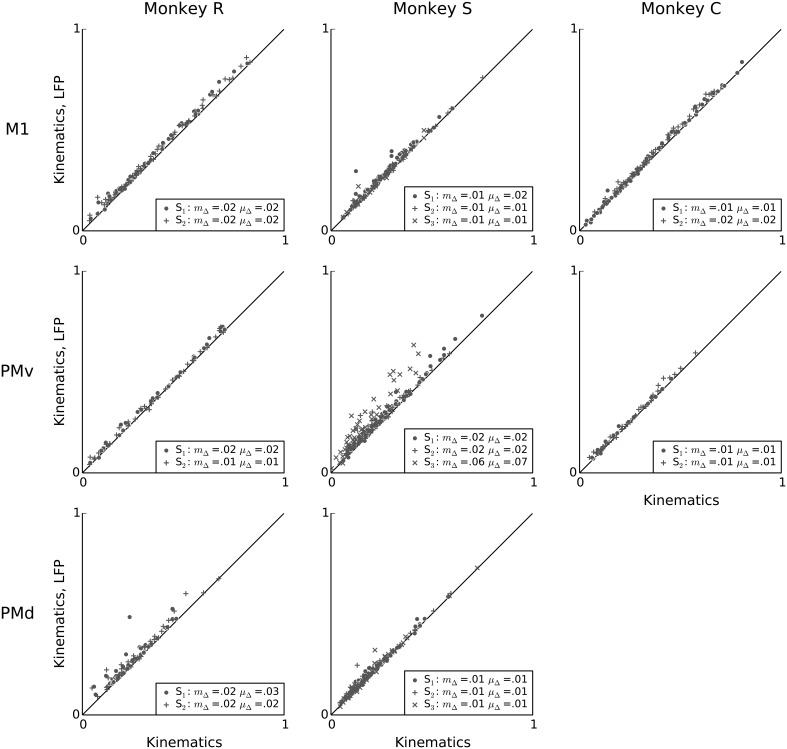
Figure 7.
LFP features add little predictive power to a kinematics model. Scatter plots comparing, on a unit-by-unit basis, the predictive power of the kinematics model (x-axis), to the predictive power of a model that uses both LFP and kinematics features (y-axis). Although LFP features by themselves can achieve high predictive power for single-neuron spiking (Figure 3), their combination with kinematics typically results in only a small increase in predictive power, suggesting that most predictive information in the examined LFP features is redundant to predictive information in kinematics features. In the figure legends, “S” indicates the session, μΔ is the mean change in predictive power, and mΔ is the median change in predictive power.

