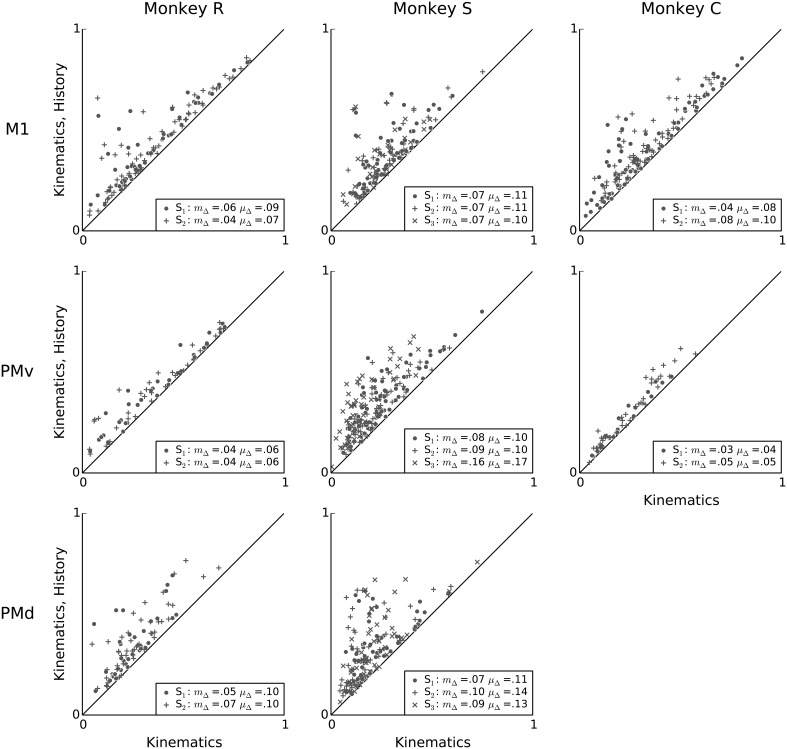
Figure 8.
Intrinsic spiking history carries complementary information to kinematics features. Scatter-plots showing a unit-by-unit comparison of the predictive power of the kinematics model (x-axis) to that of a model that uses both kinematics features and intrinsic spiking history features (y-axis). Adding 100 ms of intrinsic spiking history information improves prediction substantially for almost all units, consistently across animals and areas. In the figure legends, “S” indicates the session, μΔ is the mean change in predictive power, and mΔ is the median change in predictive power.

