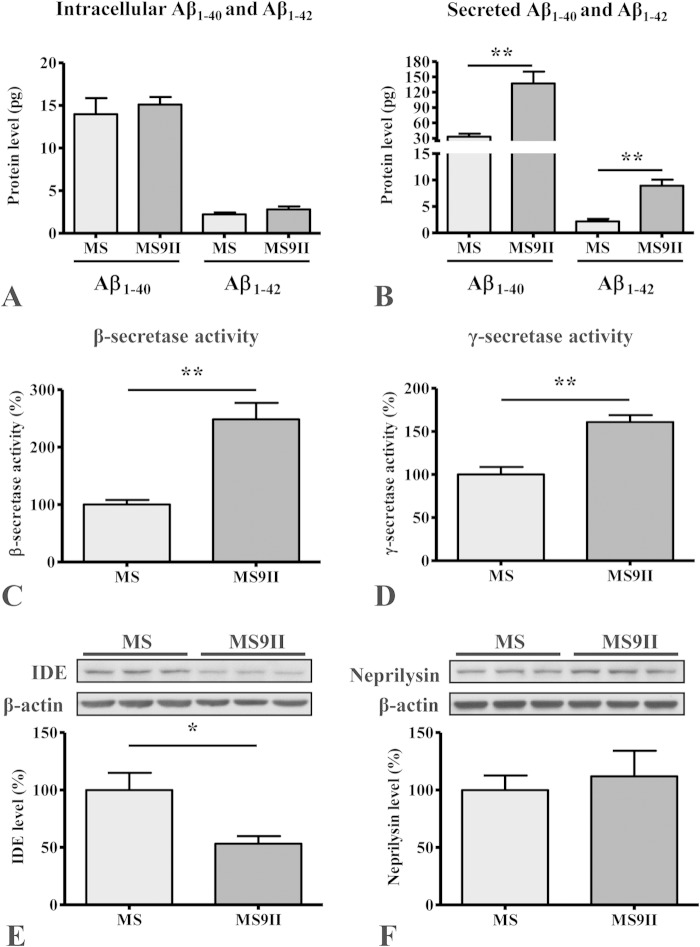
FIG 2.
(A and B) Histograms showing Aβ1–40 and Aβ1–42 levels in the cell lysates (A) and conditioned media (B) of MS9II and MS cells as detected by ELISA. Note the increased levels of Aβ1–40 and Aβ1–42 in the media but not in the cell lysates of MS9II cells compared to that in MS cells. (C and D) Histograms depicting increased activity of β-secretase (C) and γ-secretase (D) complex in MS9II cells compared to that in MS cells. (E and F) Immunoblots and respective histograms showing decreased levels of insulin-degrading enzyme (IDE) (E) and unaltered levels of neprilysin (F) in IGF-II receptor-overexpressing MS9II cells compared to those in MS cells. All Western blots were reprobed with β-actin antibody to monitor protein loading, and the values, expressed as means ± SEM, were from 3 or 4 independent experiments. Data were analyzed using Student's t test. *, P < 0.05; **, P < 0.01.

