FIG 7.
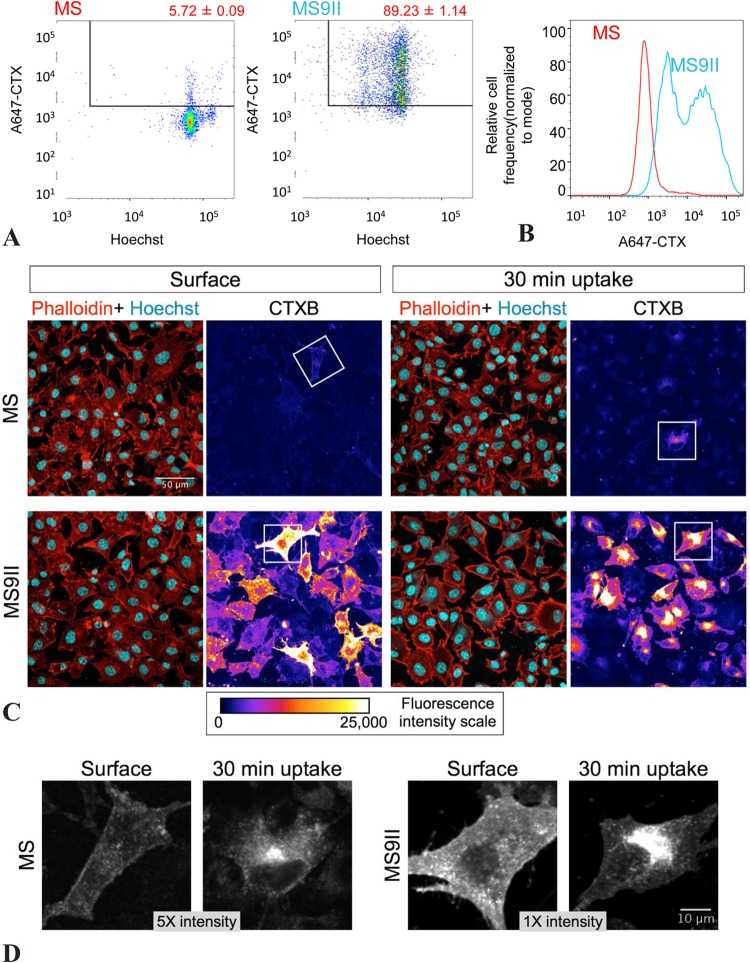
(A) Flow cytometry analysis of surface CTX labeling. Representative dot plots showing AF647-CTX and Hoechst fluorescence in MS versus MS9II cells. (B) The histogram plot shows the frequency distribution of A647-CTX fluorescence intensity of MS (red) and MS9II (blue) cells. (C) MS and MS9II cells were labeled with CTX at 4°C and fixed immediately (Surface) or following 30 min of incubation at 37°C (30 min uptake). The cells were analyzed by confocal microscopy, and AF647-CTX fluorescence intensity of representative MS and MS9II cells is depicted as pseudocolor images. Phalloidin-TRITC and Hoechst overlay images of the same field also are shown. (D) Higher magnification of cells (indicated with boxes in panel C) with brightness and contrast readjusted to visualize the cell surface (Surface) or intracellular localization of CTX (30 min uptake) in MS and MS9II cells. Note that the MS cells are displayed at five times the intensity of the MS9II cells. **, P < 0.01.

