


FIG 2.
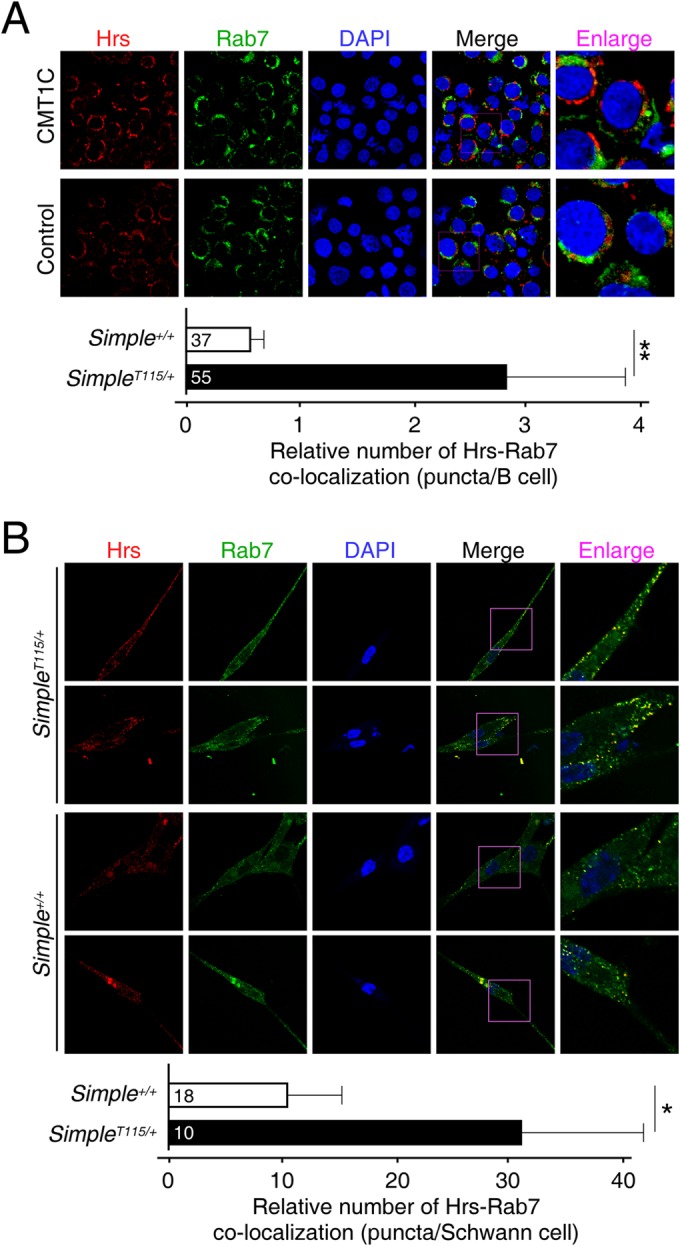
Accumulation of Hrs puncta in CMT1C patient B cells and in primary Schwann cells. Confocal microscopy was performed and costained for endogenous Hrs and Rab7 on control and CMT1C patient B cells (A) or Simple+/+ and SimpleT115N/+ mouse Schwann cells (B). DNA in nuclei was visualized using DAPI (blue). Representative images are shown. Colocalization of Hrs-Rab7 puncta was quantified. *, P < 0.05; **, P < 0.01.