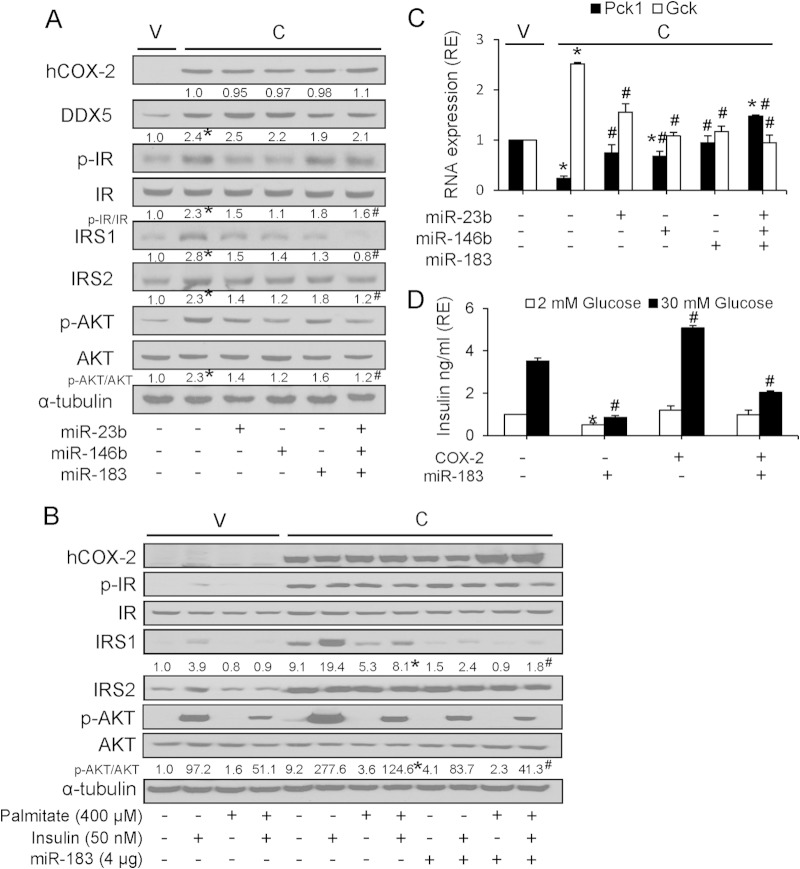
FIG 7.
Ectopic miR-183 expression counteracts the protective effect of COX-2 against insulin resistance. (A) Western blot analysis of proteins after transfection with 4 μg of pEGP-miRNA expression vectors. Results of densitometric analysis of COX-2, DDX5, p-IR/IR ratio, IRS1, IRS2, and the p-AKT/AKT ratio are reported relative to NCL-V cells (assigned a value of 1) and is represented as relative expression (RE) levels. (B) Western blot analysis of proteins after transfection with pEGP-miR183 expression vector and treatment with 400 μM palmitate and/or 50 nM insulin. Results of densitometric analysis of IRS1 and p-AKT/AKT ratio are shown. (C) Real-time PCR measurement of Pck1 and Gck mRNA in NCL-C cells after transfection with 4 μg of pEGP-miRNA. Data are reported as means ± SD of the results of three independent experiments. *, P < 0.05 (versus NCL-V cells); #, P < 0.05 (versus NCL-C cells). (D) MIN6 β cells were transfected with pPyCAGIP-COX-2 and/or pEGP-miR-183 for 48 h prior to incubation with glucose (2 or 30 mM) for 1 h. Glucose-stimulated insulin secretion (GSIS) was then assessed as described in Materials and Methods. Data are reported as means ± SD of the results of three independent experiments. *, P < 0.05 (versus 2 mM glucose); #, P < 0.05 (versus 30 mM glucose).

