FIG 3.
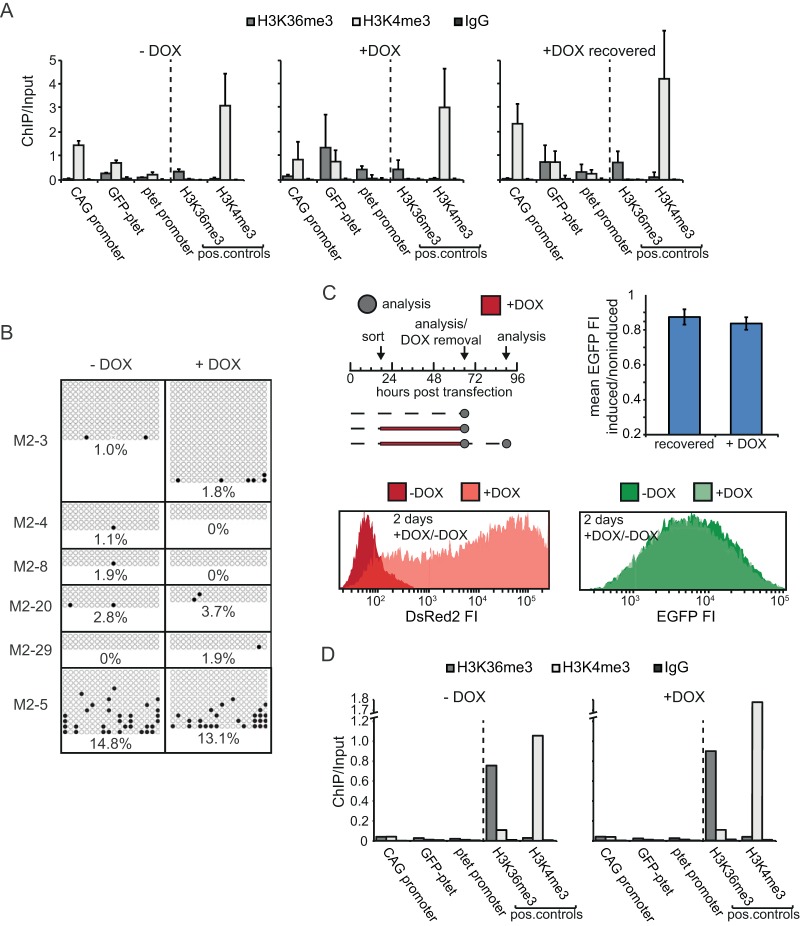
Chromatin structure in the CAG and ptet promoter regions in undifferentiated ESCs. (A) ChIP-qPCR analysis of the region encompassing CAG and ptet promoters (the CAG promoter is amplicon 4 in Fig. 1A, GFP-ptet is amplicon 5, and the ptet promoter is amplicon 6) in the M2-3 clone for noninduced (−DOX), induced (+DOX), and recovered (+DOX recovered) conditions, as outlined in the text. Antibodies against H3K36me and H3K4me3 and against whole IgG as a mock-treated control were used, as indicated. The loci analyzed, including H3K36me3- and H3K4me3-positive controls, are indicated. Values are plotted as the ratio of the original amount of template DNA for pulldown and input fractions. The mean and SD from three independent experiments are shown. (B) Bisulfite sequencing of the CAG promoter in several clones treated with doxycycline (+DOX) or not treated with doxycycline (−DOX) for 2 days. For independent clones represented in the separate panels, filled circles represent methylated CpGs and empty circles represent unmethylated CpGs. Average percentages for each condition and clone are indicated. (C) (Top left) Timing of transient-transfection experiments. Arrows, time points of sorting, analysis, and doxycycline removal; dashed lines, times that cells were grown in the absence of doxycycline; red lines, times that cells were grown in the presence of doxycycline. (Bottom) Histograms of FACS analysis of the DsRed2 and EGFP FI distribution for conditions without and with doxycycline. (Top right) Mean EGFP FI of induced and noninduced cells after 2 days of doxycycline treatment and after 2 days of doxycycline treatment followed by 1 day of recovery (recovered). Error bars represent SDs from three independent experiments. (D) Exactly as described in the legend to panel A, but for transient transfections. pos., positive.

