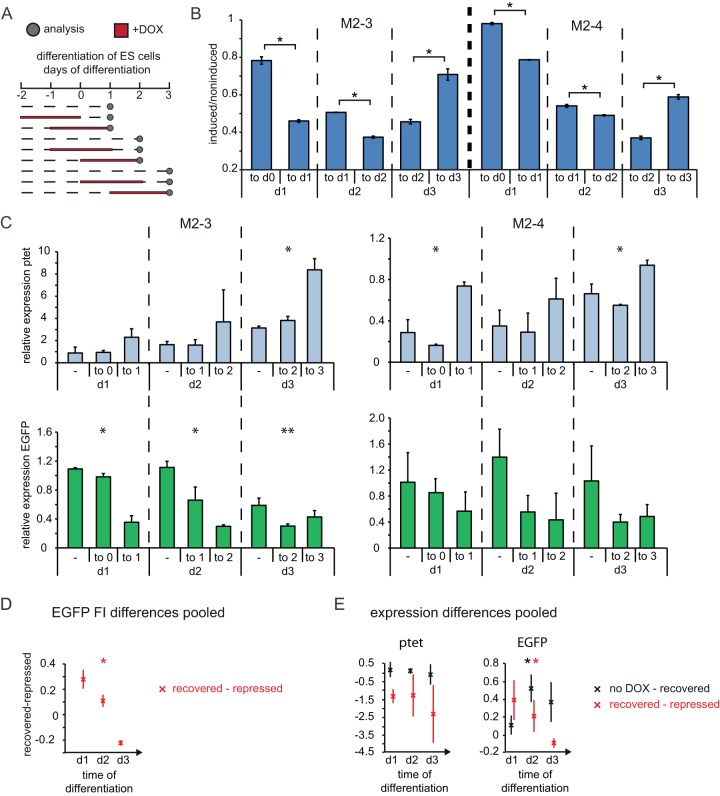
FIG 4.
Stable repression of CAG promoter by antisense transcription in differentiating ESCs. (A) Time schedule of induction experiments in differentiating ESCs. Dashed lines, times that cells were grown in the absence of doxycycline; red lines, times that cells were grown in the presence of doxycycline; dots, time points of analysis. (B) The mean EGFP FI of induced and noninduced cells is shown for cells treated for 2 days with doxycycline until the day of analysis and for cells treated for 2 days followed by 1 day of recovery, as outlined in panel A. The upper label on the x axis gives the time period of doxycycline treatment, and the lower label indicates the day of analysis. (C) Strand-specific expression analysis in noninduced, recovered, and induced cells, as outlined in panel A and the text. The upper label on the x axis gives the time period of doxycycline treatment (−, noninduced), and the lower label indicates the day of analysis. (Top) ptet proximal amplicon (amplicon 3 in Fig. 1a); (bottom) EGFP amplicon (amplicon 2). Quantification is depicted as the fold change compared to the level of expression of noninduced, undifferentiated cells. (D) Difference in EGFP FI ratios from panel B between cells after doxycycline washout (recovered) and under doxycycline treatment (repressed). (E) Difference in relative expression of ptet and EGFP from panel C between cells with no doxycycline treatment (no DOX) and recovered cells and between recovered and repressed cells. The mean and SD from two to three independent experiments for each clone are shown in panels B and C, and the mean and SD for all clones pooled are shown in panels D and E. *, P < 0.05 by a two-sample Student's t test (B) or single-factor analysis of variance (C to E); **, P < 0.1 by a two-sample Student's t test (B) or single-factor analysis of variance (C to E). d0, d1, d2, and d3, days 0, 1, 2, and 3, respectively.

