FIG 3.

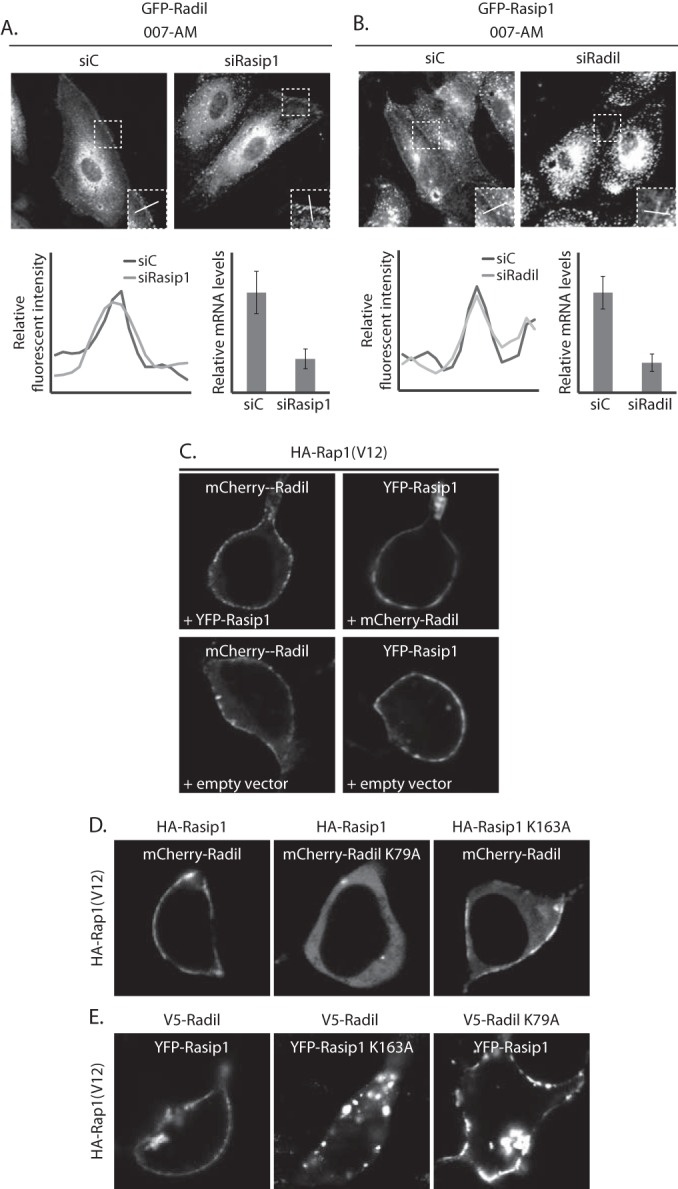
Rasip1 and Radil translocate to the plasma membrane independently. (A) The upper panel shows live imaging of GFP-Radil-expressing HUVECs, treated with control siRNA (siC), or siRNA targeting Rasip1 (siRasip1). Cells were grown to confluence and stimulated with 007-AM 15 min prior to imaging. Boxed areas are enlarged in insets. In the lower panel, the left graph shows the relative intensity profiles of fluorescent signal intensities along the line scans depicted in the boxed area. The right graph shows the knockdown efficiency as assessed by Q-PCR. (B) The upper panel shows live imaging of GFP-Rasip1-expressing HUVECs, treated with control siRNA (siC) or siRNA targeting Radil (siRadil). The cells were grown to confluence and stimulated with 007-AM for 15 min prior to imaging. The boxed areas are enlarged in insets. In the lower panel, the left graph shows the relative intensity profiles of fluorescent signal intensities along the line scans depicted in the boxed area. The right graph shows the knockdown efficiency as assessed by Q-PCR. (C) Live imaging of mCherry-Radil or YFP-Rasip1 in HEK293T cells transfected with HA-Rap1A(V12) and both mCherry-Radil and YFP-Rasip1 (upper panels), only mCherry-Radil (lower left panel), or only YFP-Rasip1 (lower right panel). (D) Live imaging of wild or mutant mCherry-Radil (as indicated) in HEK293T cells transfected with HA-Rap1A(V12) and either mCherry-Radil or mCherry-Radil K79A, together with either HA-Rasip1 or HA-Rasip1 K163A. (E) Live imaging of wild or mutant YFP-Rasip1 (as indicated) in HEK293T cells transfected with HA-Rap1A(V12) and either YFP-Rasip1 or YFP-Rasip1 K163A, together with either V5-Radil or V5-Radil K79A.
