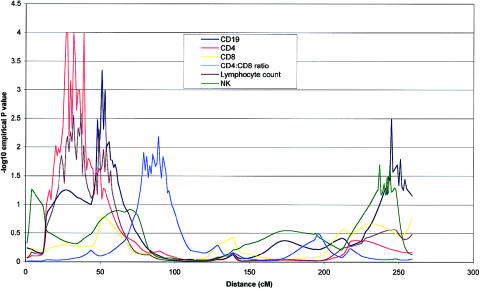
Figure 4.
Chromosome 2 multipoint map for six phenotypes under investigation. CD4, CD19, CD4:CD8 ratio, and lymphocyte count all achieved nominal P values of ⩽.01 for at least one point on the chromosome. CD4 and lymphocyte count are distinguished by an apparent region of coincident linkage around 32 cM. QTL analysis was performed as described in the legend of figure 1.

