Fig. 1.
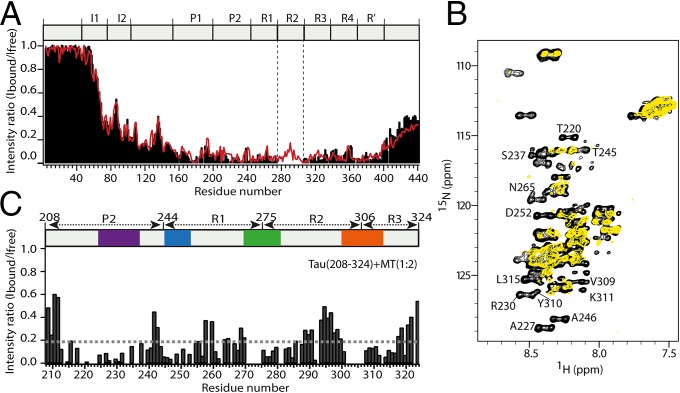
Tau binds microtubules through short evolutionary conserved sequence motifs. (A) 1H-15N NMR signal intensities of free Tau, Ifree, are compared with those of Tau bound to microtubules, Ibound (Tau:tubulin heterodimer ratio of 1:3.6). The estimated error in Ibound/Ifree according to the signal-to-noise ratio in the spectra was on average 0.08. Data for three-repeat Tau are shown as red line. The absence of repeat R2 in three-repeat Tau is indicated by vertical dashed lines. Tau’s domain organization is shown on top: I, insert; P, proline-rich region; R, repeat. (B) Superposition of 1H-15N CRINEPT-HMQC-TROSY spectra of Tau(208-324) in the free (black) and microtubule-bound (yellow) state acquired at 30 °C. The Tau(208-324):tubulin heterodimer ratio was 1:2. Selected resonances, which are strongly attenuated when Tau(208-324) is bound to microtubules, are labeled. (C) Signal intensity profile of Tau(208-324) bound to microtubules. NMR intensities were obtained from the spectra shown in B. At a Tau(208-324):tubulin heterodimer ratio of 1:2, Tau(208-324) is fully bound to microtubules (26). The detection of signals from residues in between the microtubule-binding motifs shows that these Tau residues remain flexible in the Tau–microtubule complex.

