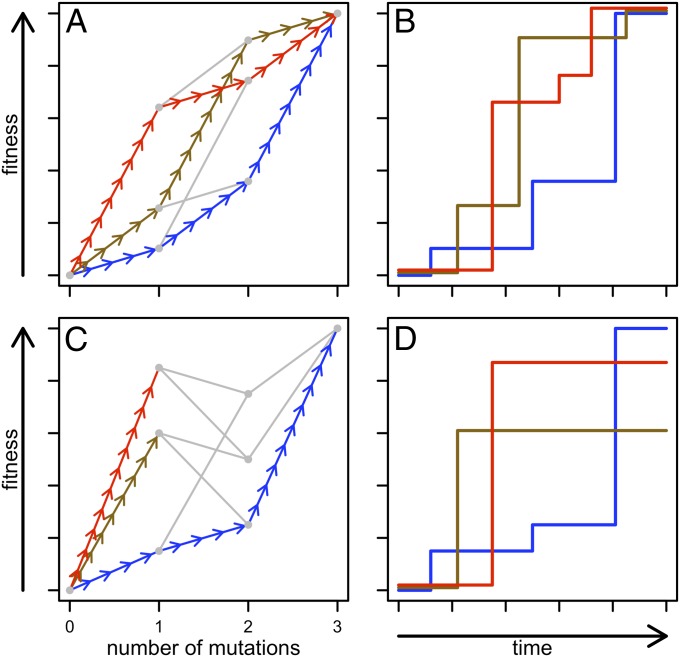
Fig. 1.
Adaptive paths in hypothetical landscapes. Here, we consider a simple biallelic three-locus system. (A) Adaptive landscape can be visualized by plotting genotype fitness as a function of the number of mutations on a WT background. Each of the 23 = 8 genotypes is given by a gray point, and edges (arrows or gray lines) connect genotypes differing by a single mutation. An adaptive peak is a genotype from which all mutations are detrimental. A hypothetical landscape with a single peak (the triple mutant) is shown here. A selectively accessible path exists between two genotypes if a series of beneficial mutations connect the less fit genotype to the more fit genotype. On this “smooth” landscape, all of the 3! = 6 paths between the WT (lacking mutations) and the triple mutant are selectively accessible; three of these paths are shown by the arrows in different colors. (B) Average fitness over time is shown for three possible populations following the paths in A. If we assume that selection is strong and mutation is weak, we can represent the fixation of each beneficial mutation as a step up in the fitness trajectory. All trajectories converge on the same final fitness value. (C) Hypothetical landscape with multiple peaks. Starting with the WT, mutation and selection can take the population to different adaptive peaks on this “rugged” landscape, as illustrated by the different colored trajectories. (D) Average fitness over time is shown again for three possible populations following the paths in C. The final fitness of different evolving populations can vary.

