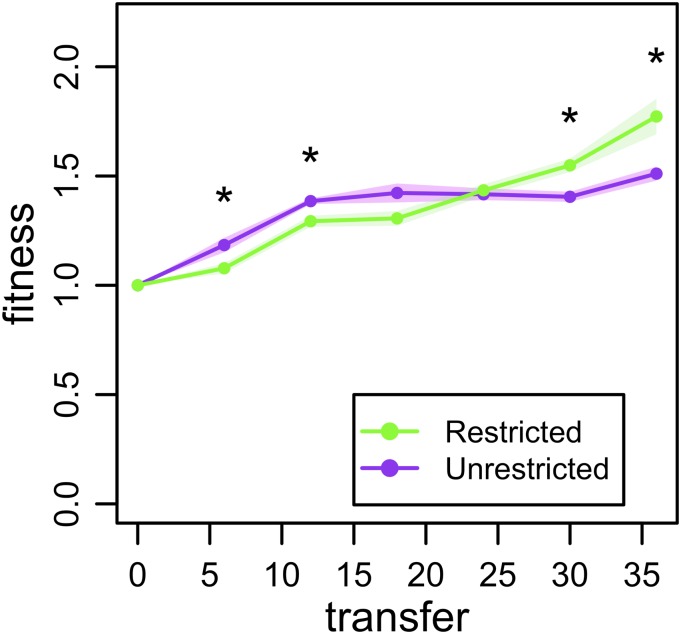
Fig. 4.
Bacterial fitness. Metapopulations of bacteria evolved where migration was spatially restricted or unrestricted. The average relative fitness of five isolates randomly sampled from the metapopulation is shown every six transfers. As in Fig. 2B, the ordering of fitnesses for the two treatments flips over time. Each point represents the mean of five replicate metapopulations, shading gives the SEM, and asterisks denote significant differences.

