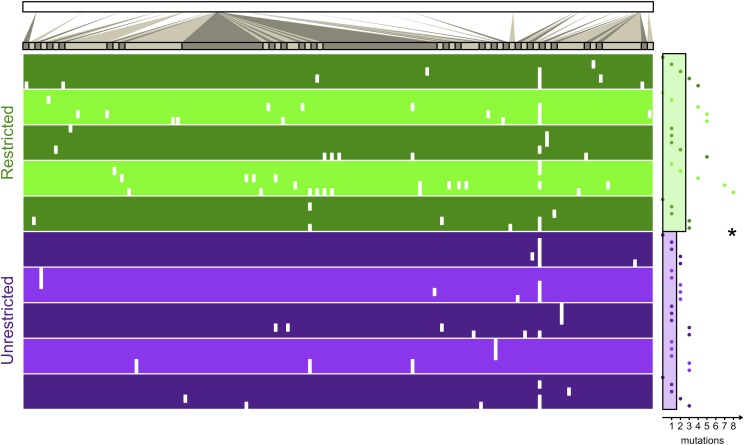
Fig. 5.
Bacterial distance. Metapopulations of bacteria evolved where migration was spatially restricted or unrestricted. At the end of the experiment, five isolates from each metapopulation were sequenced at the genome level. The top bar represents the genome of E. coli. Genome regions with mutations are magnified for the table. Each isolate is a single row in the table, and the location of each of its mutations is indicated by a white mark (no mutation inside a coding region was synonymous). The five isolates from each of the five replicate metapopulations are grouped by alternating shades of green (for the Restricted treatment) or purple (for the Unrestricted treatment). The horizontal distance of the point to the right of the table denotes the number of mutations in the isolate (its evolutionary distance). The horizontal distance of the green bar and the purple bar to the right of the table gives the average distance (the average of replicate averages) of isolates from the Restricted and Unrestricted treatments, respectively. The asterisk denotes a significant difference between treatments. More information regarding each mutation can be found in SI Appendix.

