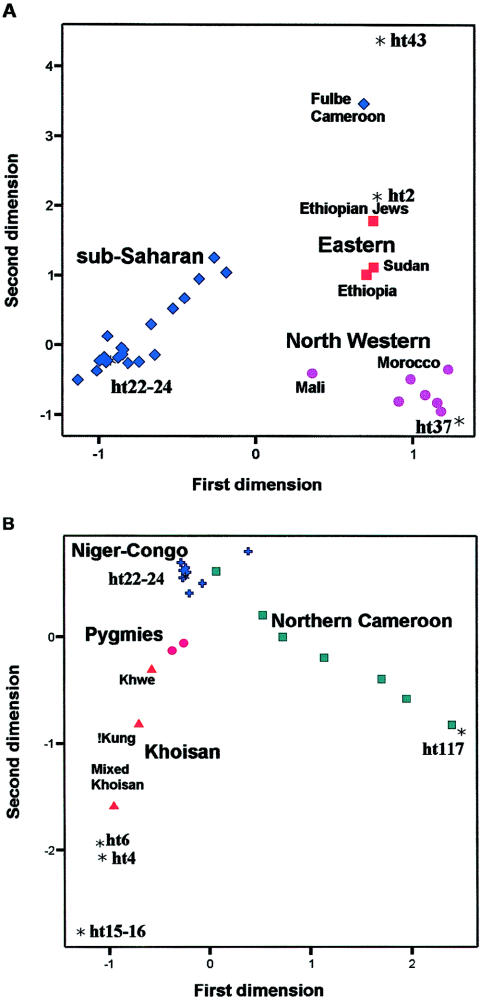
Figure 3.
Correspondence analysis scores; plot of populations and haplotypes in the space of the first (X-axis) and second (Y-axis) dimension. Only the haplotypes (represented by asterisks [*]) most contributing to the inertia of the first and/or second dimension are represented. A, 31 African populations, including the 22 populations listed in table 1, 5 populations from Underhill et al. (2000), and 4 Moroccan populations from Bosch et al. (2001). Symbols used to identify groups of populations are as follows: diamonds, sub-Saharan Africans; circles, northwestern Africans; squares, eastern Africans. B, Correspondence analysis for the 20 African populations having negative scores for the first dimension in the previous analysis. The following symbols have been used to identify groups of populations: triangles, Khoisan; circles, Pygmies; squares, northern Cameroonians; crosses, other sub-Saharan Africans (populations from Burkina Faso and Bantu-speaking populations from southern Cameroon and southern Africa).

