Fig. 1.
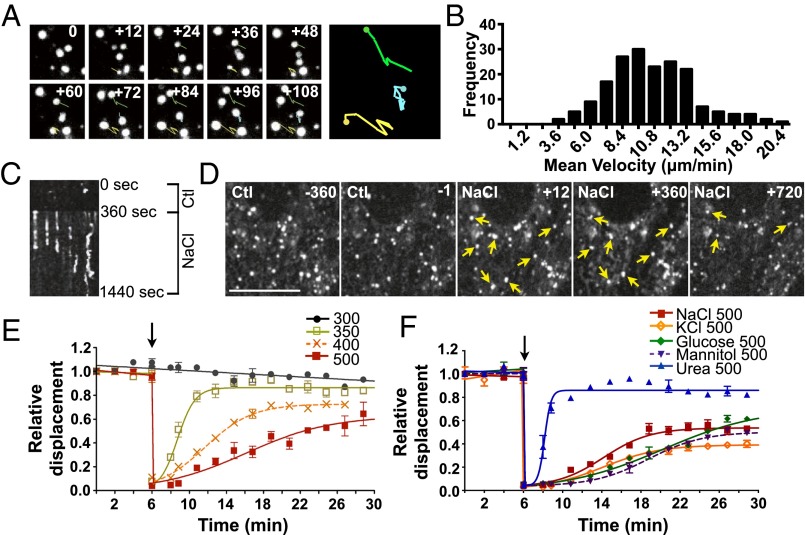
Endosome motility is transiently abolished by hypertonic challenge. (A) The mean velocity of FITC-dextran–loaded endosomes in LLC-PK1 cells was quantified by measuring mean endosome displacement over 2 min at 12-s intervals. Shown are examples of movement occurring under isotonic conditions. (B) Histogram of endosome motility occurring under isotonic conditions. Data were gathered from 120 endosomes. (C) Kymograph illustrating endosome motility occurring in a single focal plane (x axis) over time (y axis) 360 s before and 1,080 s after exposure to hypertonic medium (500 mOsmol/kg). Endosomes that were mobile under isotonic conditions or after long periods of exposure to hypertonic medium produced dim or jagged lines, whereas endosomes immobilized upon challenge produced straight lines. (D) Displacement of endosomes at 360 and 1 s before (Ctl) and 12, 360, and 720 s after NaCl challenge. Arrows show examples of immobilized endosomes. (Scale bar: 10 µm.) (E and F) Endosome motility is shown normalized to the average displacement under isotonic conditions (first 6 min). Motility at 12 s after challenge is shown also to illustrate nearly instantaneous endosome immobilization. Endosome motility was quantified before and after (arrow) NaCl challenge (350, 400, 500 mOsmol/kg) (E) and before and after (arrow) NaCl, KCl, glucose, mannitol, or urea challenge (500 mOsmol/kg) (F). (Also see Movie S1). Error bars show mean ± SEM from four independent experiments.

