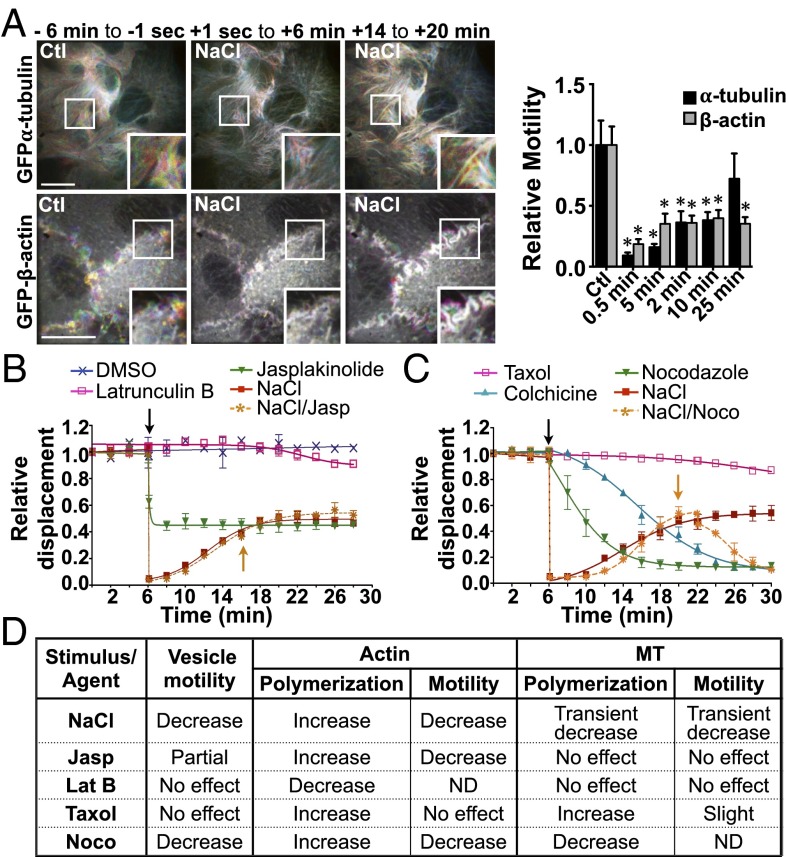
Fig. 3.
Reduced vesicle motility by hypertonicity relies on reduced microfilament dynamics rather than sudden shifts of their polymerization states. (A) Time-lapse pseudocolored images of GFP-β-actin (Lower Row) and GFP-α-tubulin (Upper Row) live-cell movies illustrate the extent of microfilament motility in LLC-PK1 cells. (Left) Six minutes prechallenge (−6 min to −1 s). (Center) Zero seconds to six minutes (+1 s to 6 min) after NaCl challenge (500 mOsmol/kg). (Right) Fourteen to twenty minutes (+14 min to +20 min) postchallenge. (Scale bars: 10 µm.) Representative images are shown on the left, and motility quantification is shown on the right. Data were gathered from three independent experiments. (B) FITC-dextran–loaded endosome motility in LLC-PK1 cells before and after (arrow) the addition of latrunculin B (2.5 µM), jasplakinolide (0.4 µM), or NaCl (500 mOsmol/kg) or before and after NaCl challenge followed by the addition of jasplakinolide (orange arrow) once steady-state levels were reached. *P < 0.05 vs. control. (C) FITC-dextran–loaded endosome motility in LLC-PK1 cells before and after the addition of taxol (10 µM), colchicine (10 µM), nocodazole (10 µM), or NaCl (500 mOsmol/kg) or before and after (arrow) NaCl challenge followed by the addition of nocodazole (NaCl/Noco; orange arrow) once steady-state levels were reached. Error bars show mean ± SEM from four independent experiments. (D) Recapitulative table of the effects of NaCl and drugs on vesicle motility and microfilament polymerization and motility. Agents that decrease microfilament motility also decrease vesicle motility. ND, not determined. (Also see Figs. S4–S6 and Movies S4–S6.)

