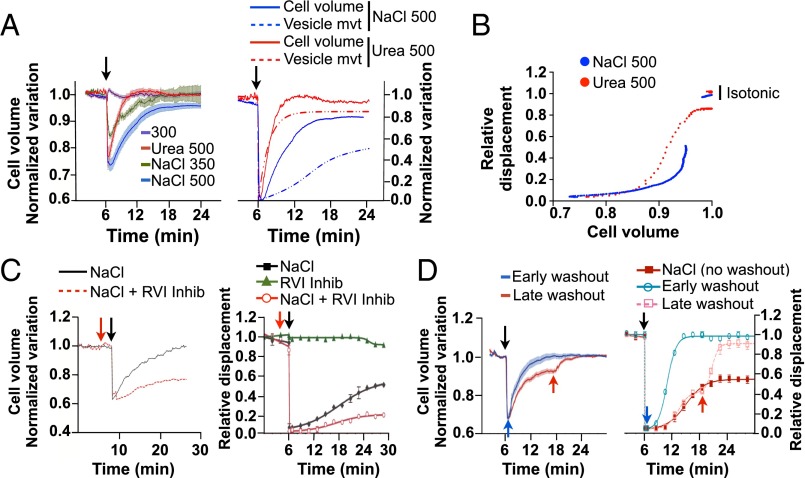
Fig. 4.
Vesicle motility following NaCl-hypertonic challenge recovers well after cell volume is restored. (A, Left) LLC-PK1 cell volume was measured using calcein-AM under isosmotic conditions and after challenge (arrow) with NaCl (350 or 500 mOsmol/kg) or urea (500 mOsmol/kg). (Right) LLC-PK1 cell volume (solid lines) and FITC-dextran–loaded endosome motility (vesicle mvt, dotted lines) after challenge with NaCl or urea (500 mOsmol/kg), normalized to maximal variations for comparison of their recovery kinetics. (B) Projected FITC-dextran–loaded endosome motility in LLC-PK1 cells as a function of cell volume. (C) LLC-PK1 cells were challenged or not with an RVI inhibitor mixture (red arrow), and cell volume (Left) and FITC-dextran–loaded endosome motility (Right) were measured before and after (arrow) NaCl challenge (500 mOsmol/kg). (D) LLC-PK1 cell volume (Left) and FITC-dextran–loaded endosome motility (Right) before and after NaCl challenge (500 mOsmol/kg) and after osmolality returned to basal, isotonic conditions, either immediately after challenge or after a longer period (12 min), when near-maximal volume recovery was reached (blue and red arrows, respectively). Error bars show mean ± SEM from four independent experiments.

