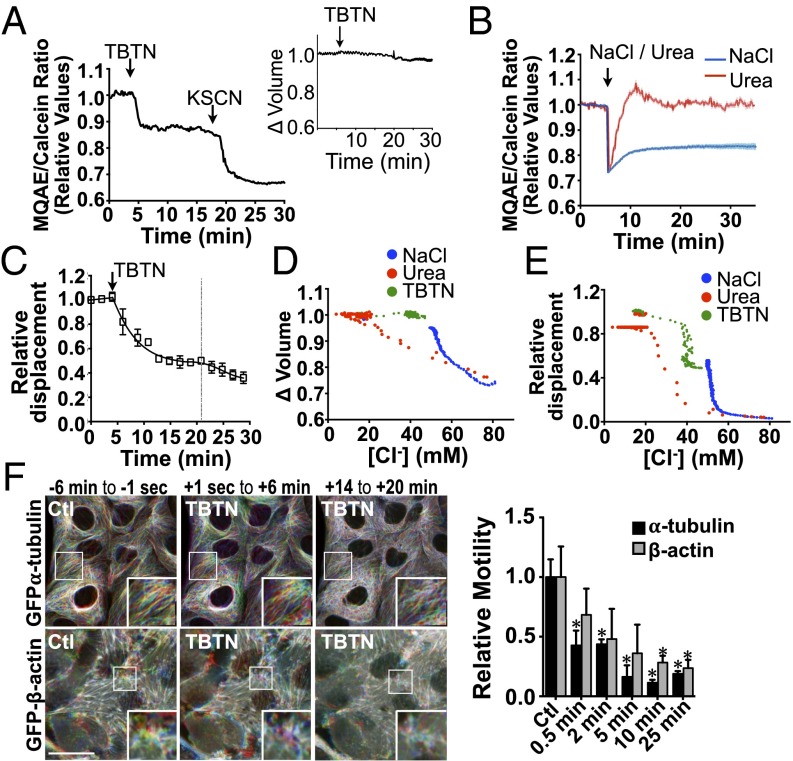
Fig. 5.
An isovolumetric increase in [Cl−]i decreases vesicle and microfilament motility. (A and B) LLC-PK1 cells were challenged (arrows) with the ionophores nigericin (5 µM)/tributyltin chloride (10 µM) (TBTN) (A), NaCl (500 mOsmol/kg), or urea (500 mOsmol/kg) (B). Error bars show mean ± SEM from three independent experiments. Relative changes of MQAE fluorescence were measured as the normalized emission ratio of MQAE (360 nm) to calcein (488 nm). MQAE quenching by KSCN (150 mM) confirms the probe was operating within its dynamic range. Inset in A shows changes in cell volume measured with calcein alone. (C) Decreased FITC-dextran–loaded endosome motility in LLC-PK1 cells after TBTN challenge (arrow). Error bars show mean ± SEM from four independent experiments. Curve fitting after TBTN challenge, indicated by the dotted line, was performed in two separate phases. (D and E) [Cl−]i as a function of cell volume (D) and projected FITC-dextran–loaded endosome motility (E) in LLC-PK1 cells. (F) Time-lapse pseudocolored images of GFP-α-tubulin and GFP-β-actin in LLC-PK1 cells before and after (arrow) TBTN challenge illustrating decreased but not abolished motility in both microfilaments after challenge. (Scale bar: 10 µm.) Representative images are shown on the left, and motility quantification is shown on the right. Error bars show mean ± SEM of three independent experiments. *P < 0.05 vs. control.

