Fig. S1.

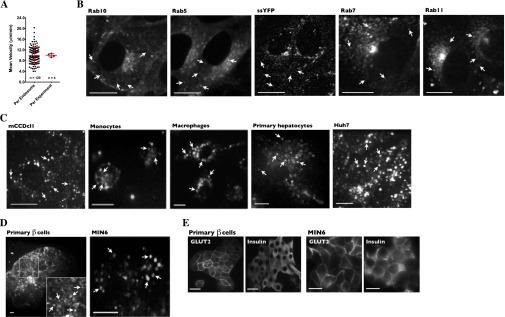
Fluorescent labeling of endosome/vesicle subpopulations. (A) Although the motility of individual FITC-dextran–loaded endosomes (n = 120) varies greatly, the variance of the average endosome motility between experiments (n = 4) is much smaller. Error bars show means ± SD. (B) LLC-PK1 cells were transiently transfected with cDNA encoding various fluorescent proteins used as markers to trace motilities of distinct endosome/vesicle subpopulations, as described in the legend of Fig. 1. (C and D) Various primary cells and stable cell lines were loaded with FITC-dextran to investigate early/late endosome motility. Arrows indicate examples of fluorescently labeled endosomes. (E) GLUT2 and insulin expression in primary β cells (Left) and MIN6 cells (Right). Cell clusters of primary pancreatic cell preparations consisted principally of β cells, as reflected by high levels of GLUT2 at the plasma membrane and intracellular insulin. (Scale bars: 10 µm.)
