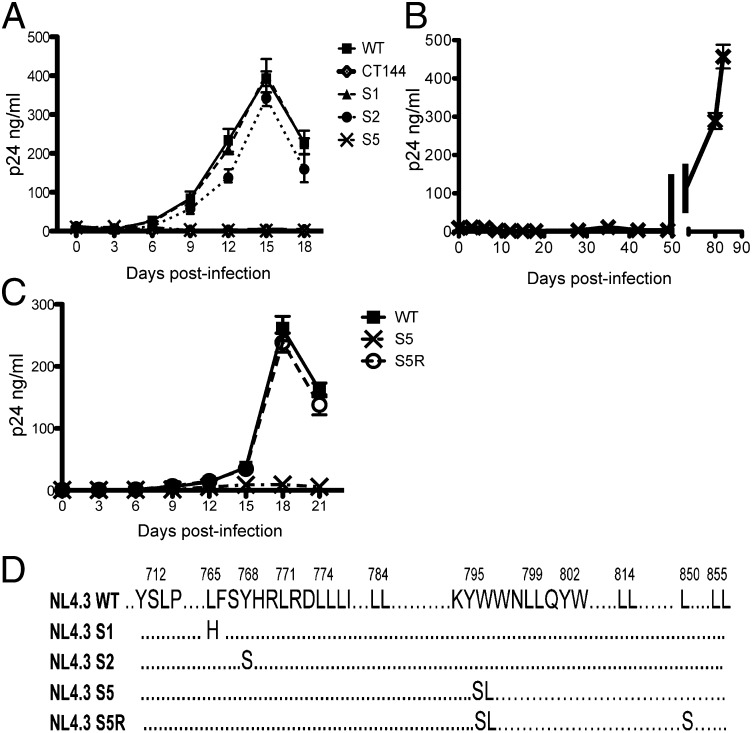
Fig. 2.
Growth curve of S5 mutant in H9 cell culture and revertant analysis. (A) H9 cells were infected with WT, CT144, and three selected Env CT mutants from the CT panel. A total of 50,000 H9 cells were infected with VSV-G–pseudotyped virus at MOI 0.1. Culture supernatants were collected for each virus every 3 d for p24 quantitation. Note that CT144 and S5 virus production is not detected on this scale. (B) S5 was cultured for an extended time; note break in x axis timescale. (C) Revertant S5R virus and comparator viruses were introduced into H9 cells for growth curve generation as in A. (D) Diagram depicting relevant WT and mutant CT sequences including S5 and S5R changes.

