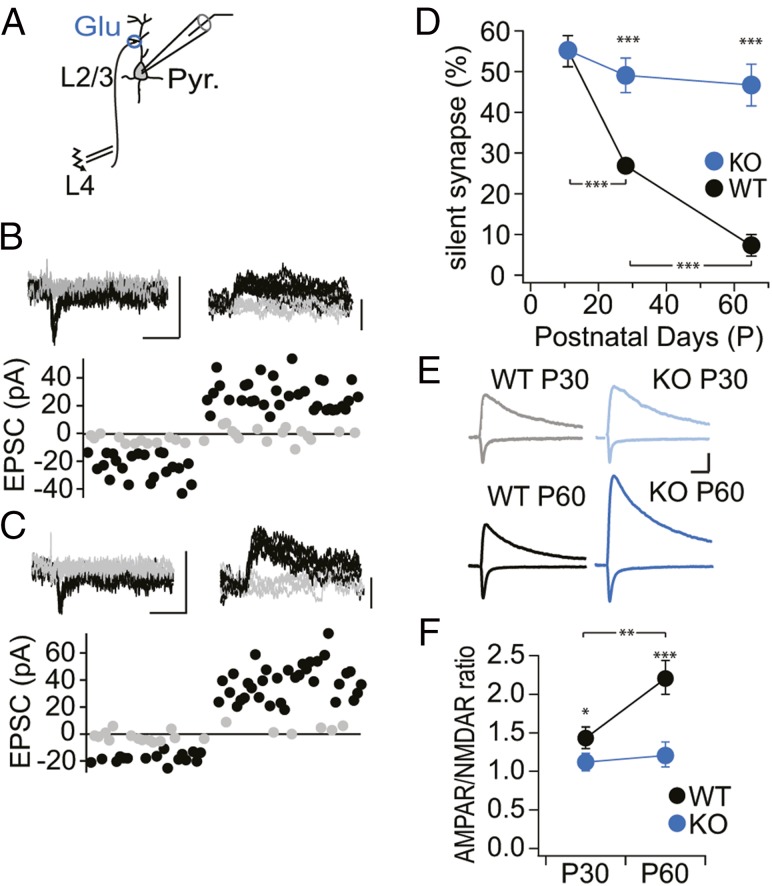
Fig. 2.
Impaired developmental maturation of glutamatergic synapses in the visual cortex of PSD-95 KO mice. (A) Schematic drawing of the electrophysiological recording configuration in slices of the binocular segment of mouse V1. Pyramidal neurons (Pyr.) in L2/3 were patched in voltage-clamp mode, and synaptic afferents were stimulated extracellularly in L4. (B and C) Sample traces of EPSCs with minimal stimulation of P60 WT (B) and KO (C) mice to record unitary responses (Upper) and analysis of the peak values of AMPA receptor EPSCs, recorded at Vh = −60 mV (downward deflection) or composite glutamate receptor EPSCs, recorded at Vh = +40 mV (upward deflection) of successes (black) and failures (gray) of individual EPSCs. (Scale bar for B, C, and E, 20 ms and 50 pA.) (D) Summary graph of percentage of silent synapses [Fag(2,14) = 35.77, P < 0.001; Fgt(1,14) = 58.35, P < 0.001; WT P10, n/m = 10/3; KO P10, n/m = 10/3; WT P30, n/m = 15/4; KO P30, n/m = 8/3; WT P60, n/m = 14/4; KO P60, n/m = 11/3; WT P10 vs. KO P10, KO P10 vs. KO P30, KO P30 vs. KO P60, KO P10 vs. KO P60; all P > 0.05]. (E) Sample traces of EPSCs were recorded at Vh = −60 mV and Vh = +40 mV from WT controls (P20–30/P60–70 in gray/black) and PSD-95 KO mice (P20–30/P60–70 in light blue/blue). (F) Summary graph of AMPA/NMDA receptor EPSC ratios [Fag(1,10) = 7.18, P < 0.05; Fgt(1,10) = 45.97, P < 0.001; WT P30, n/m = 19/5; KO P30, n/m = 19/3; WT P60, n/m = 14/3; KO P60, n/m = 13/3: KO P30 vs. KO P60; P > 0.05]. *P < 0.05; **P < 0.01; ***P < 0.001. Values in Table S2.

