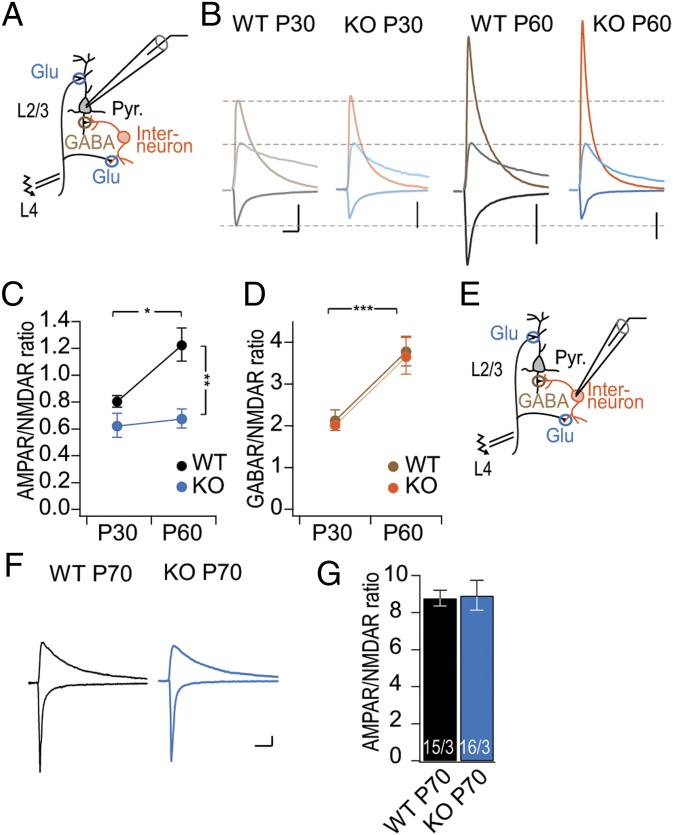
Fig. 4.
Local inhibitory tone was normal in adult PSD-95 KO mice. (A) Schematic drawing of the electrophysiological recording configuration, similar to Fig. 2. Local interneurons are excited by the glutamatergic afferents (Glu) and synapse onto Pyr (GABA). (B) Sample traces of synaptic responses from L2/3 pyramidal neurons. Synaptic responses were separated into different components by clamping the neurons at the other receptors reversal potentials and specific antagonists. AMPA receptor EPSCs were recorded at the equilibrium potential of Cl− at Vh = −72 mV (downward deflected traces in gray/black for P30/P60 WT and in light blue/dark blue for P30/P60 PSD-95 KO). GABA receptor IPSCs were recorded close to the reversal potential of glutamate receptors at Vh = 0 mV (upward deflected traces in light brown/brown for P30/P60 WT and in light orange/dark orange for P30/P60 PSD-95 KO mice). NMDA receptor EPSCs were recorded at Vh = +40 mV in the presence of the AMPA receptor blocker NBQX (10 µM) and GABA-A receptor blocker picrotoxin (50 µM; upward deflected traces in light gray/gray for P30/P60 WT and in light blue/dark blue for P30/P60 PSD-95 KO). (Scale bars, 20 ms and 200 pA.) (C and D) Summary graphs of the AMPA/NMDA receptor (C) and GABA/NMDA receptor ratios (D) (color code as in B). [C: Fag(1,10) = 6.22, P < 0.05; Fgt(1,10) = 18.17, P < 0.01; WT P30, n/m = 16/4; WT P60, n/m = 16/4; KO P30, n/m = 17/3; KO P60, n/m = 14/3; KO P30 vs. KO P60, P > 0.05; and D: Fag(1,10) = 32.75, P < 0.001; Fgt(1,10) = 0.18, P = 0.68; WT P30, n/m = 16/4; WT P60, n/m = 16/4; KO P30, n/m = 17/3; KO P60, n/m = 14/3; WT P60 vs. KO P60; P > 0.05.] (E) Schematic drawing of recording configuration for monosynaptic stimulation of interneuron. (F) Sample traces of synaptic responses from L2/3 PV+ interneurons with AMPAR EPSCs recorded at Vh = −60 mV and composite AMPA-NMDAR EPSCs at Vh = +40 mV of indicated genotype and age. (G) Summary graphs of the AMPA/NMDA receptor ratio for PV+ interneurons (WT P60 vs. KO P60, P = 0.89). Number of cells/mice in the foot of the bar. *P < 0.05; **P < 0.01; ***P < 0.001. Values in Table S4.

