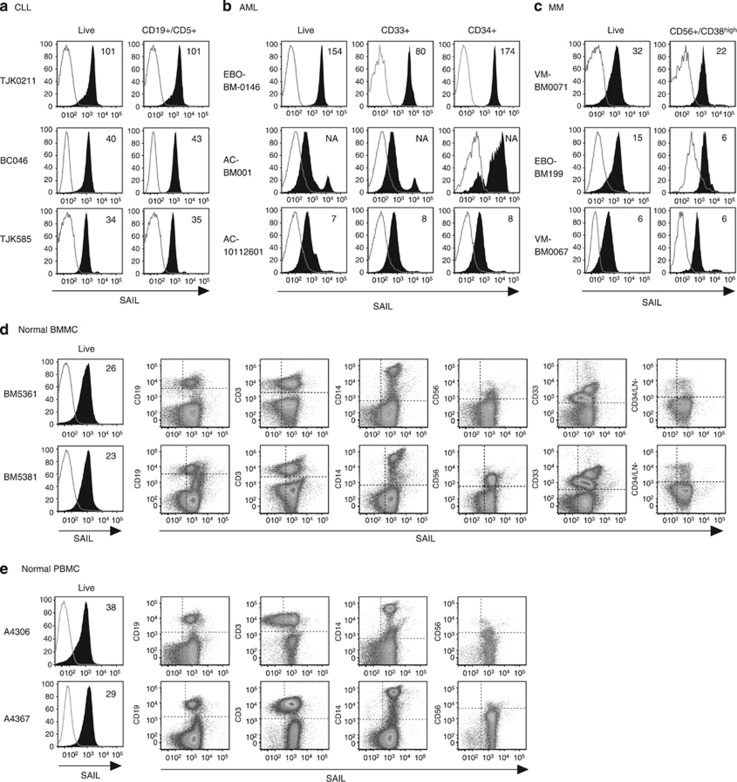
Figure 2.
Cell surface expression of SAIL in CLL, AML and MM patient samples and normal BMMC and PBMC controls. (a) Three CLL specimens analyzed by flow cytometry. CLL cells were identified as CD19/CD5 double-positive cells. The histograms present SAIL (filled) and isotype control (open) staining in the live-cell and the CLL population. (b) Flow cytometry analysis of three AML specimens. SAIL expression is assessed in live-cells, CD33-positive and CD34-positive cells. (c) Flow cytometry analysis of three MM specimens. CD38high cells with CD56 expression were gated for MM cells. SAIL expression is assessed in the live-cell and the MM population. (d and e) Flow cytometry analysis of SAIL expression in BMMC (d) and PBMC (e) via co-staining with CD19, CD3, CD14, CD56, CD33, CD34 and a cocktail of lineage (LN) markers. Numbers in histograms are median-fluorescence-intensity fold-change values relative to the isotype control. Three and two representative examples are shown for the tumor and normal samples, respectively.

