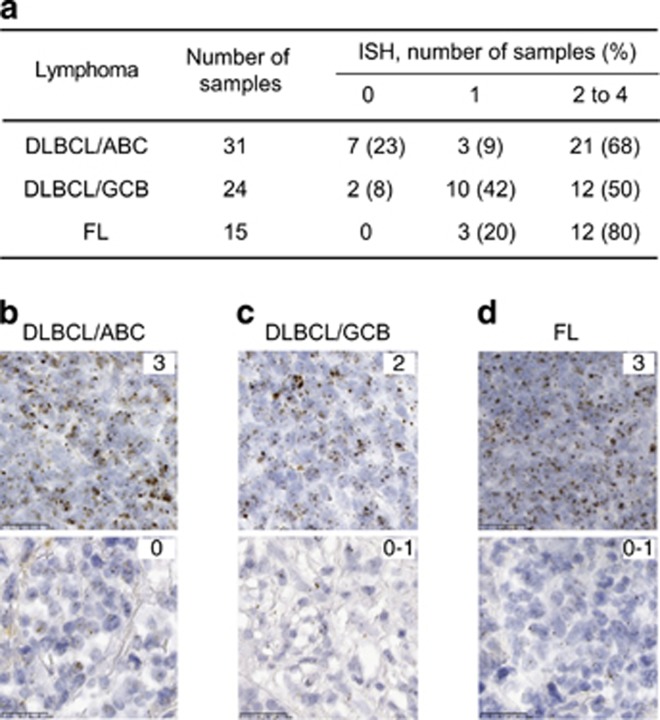
Figure 3.
RNA ISH analysis of SAIL expression in non-Hodgkin's lymphoma tissue microarrays. (a) The number of samples tested for each tumor type is shown along with the percentage of ISH scores on a 0 to 3 scale. Examples of strong (score 3) and negative/weak (score 0–1) SAIL expression in the ABC (b) and GCB (c) subtypes of DLBCL and FL (d).

