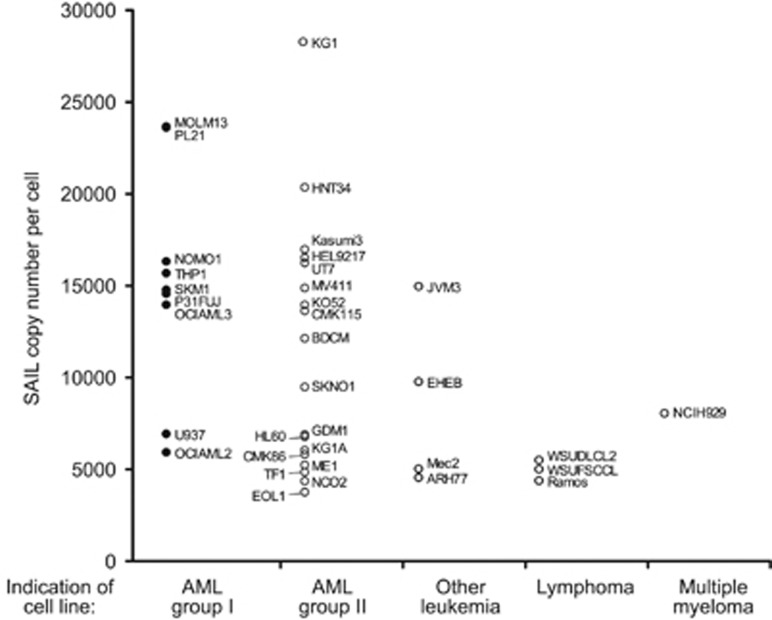
Figure 4.
Quantitative flow cytometry analysis of SAIL expression in hematologic tumor cell lines. SAIL expression was analyzed in anti-SAIL ADC-sensitive (AML group I, black circle) and -nonsensitive (AML group II, other leukemia, lymphoma and MM, empty circle) cells. Cell lines in which the specific ADC IC50 was achieved at concentrations greater than 1 nM were considered nonsensitive. Data represent the mean of at least two independent fluorescence quantitation experiments per cell line. Only the cell lines with greater than 3000 copies per cell were considered for this analysis.

