
Fig. 6.
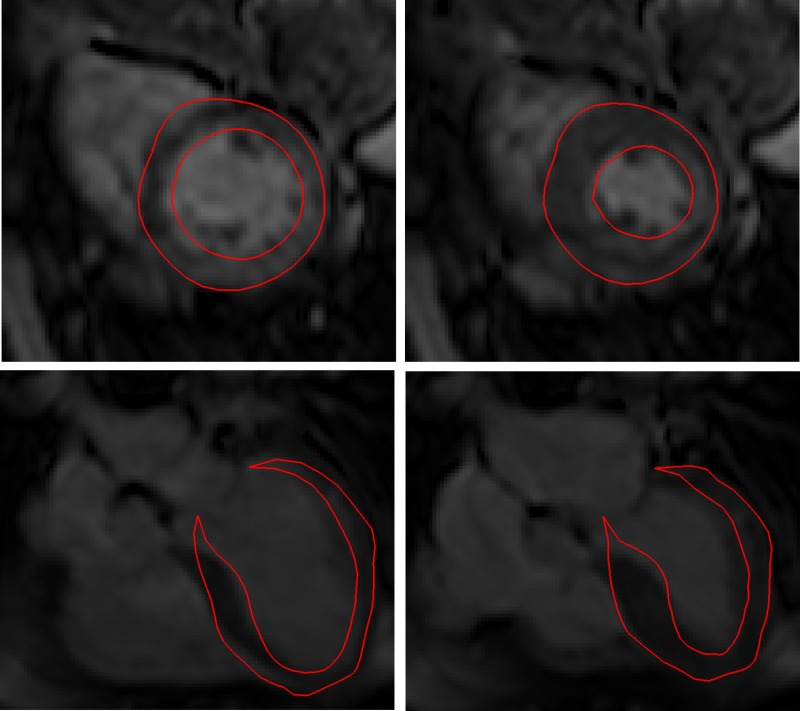
Comparison of the ventricular deformation at ED (left) and end-systole (right), predicted by the personalized finite-element model (red line) and measured by cine MRI, in short-axis (top) and long-axis (bottom) views. The overall deformation pattern is well reproduced by the model.