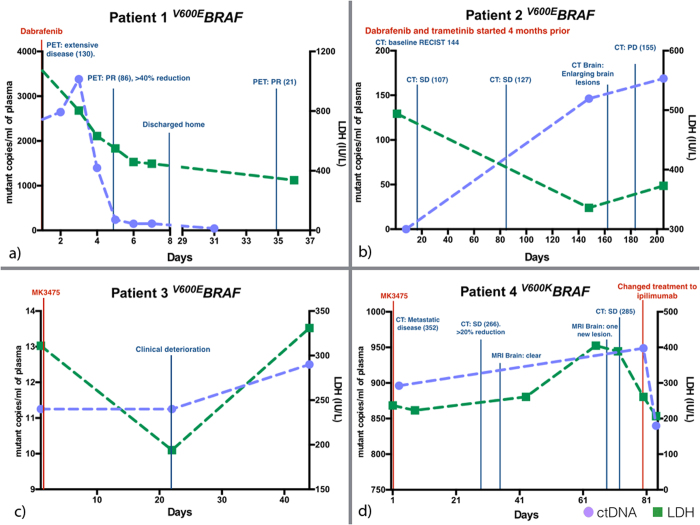
Figure 2. ctDNA and LDH level monitoring with clinical follow up for patient (a) 1, (b) 2, (c) 3 and (d) 4.
ctDNA and LDH levels recorded with corresponding scan results. ctDNA level showed dynamic changes corresponding with disease progression. (Numbers in brackets correspond to the RECIST score. PR: partial response. PD: progressive disease. SD: stable disease.) The upper limit of normal LDH level in an adult is 250 IU/L. (a) Patient 1 showed a 98.3% decrease in ctDNA level following initiation of dabrafenib. The level stayed low as patient improved clinically with tumour shrinkage seen on PET scans with associated falling in RECIST score. (b) Patient 2 developed drug resistance evident with increasing tumour size. The ctDNA level also increased accordingly. However, patient’s LDH level fell paradoxically with rising tumour burden. (c) Patient 3 had multiple spinal metastases and we were unable to perform radiological scans to monitor the disease progression secondary to the metallic implant to stabilize the spine. The patient deteriorated despite new drug treatment (MK-3475). The LDH level fell initially after initiation of the new drug and then rose. The ctDNA level on the contrary never decreased with the new treatment. (d) Patient 4 started MK3475 after failing dabrafenib and trametinib with increasing intra and extra-cranial metastasis. All extracranial lesions responded well but the intracranial lesions continued to progress. This is reflected in the generally increasing ctDNA level, potentially representing remaining disease activity in treatment resistant intracranial lesions. The level fell when ipilimumab was added to the treatment regimen.

