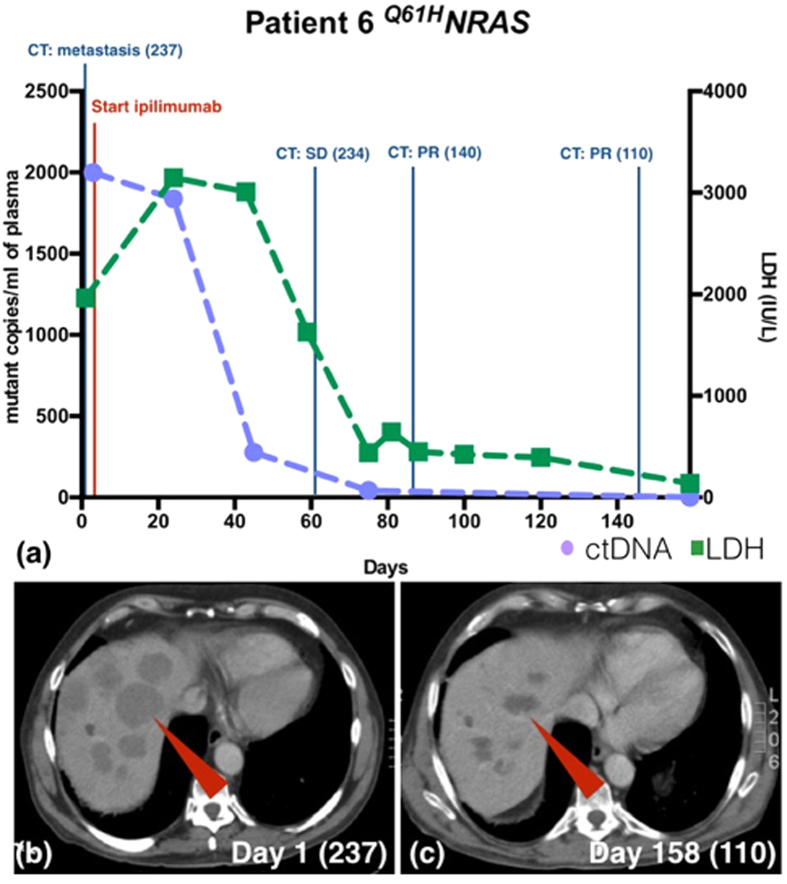
Figure 4. ctDNA and LDH level monitoring for patient 6 with corresponding radiological findings.
(a) Patient 6’s ctDNA level fell rapidly after initiation of ipilimumab consistent with tumour shrinkage. The LDH level started to fall one month later than ctDNA level. (b) The CT image shows multiple large liver metastases (red arrow). The RECIST score was 237 on day 1 of treatment. (c) On day 158 since initiation of ipilimumab, the liver metastases have shrunken significantly (RECIST score 110).

