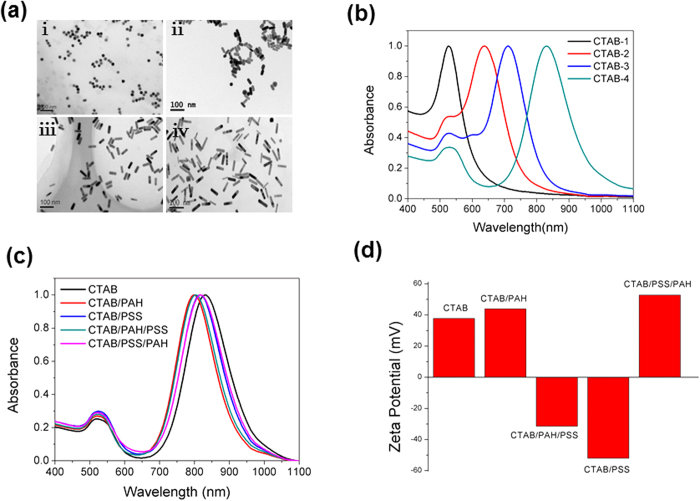
Figure 1. Characterization of GNRs by transmission electron microscopy (TEM) and visible and near-infrared absorption spectra.
(a) TEM images of CTAB-coated GNRs with different aspect ratios: (i) CTAB-1, (ii) CTAB-2, (iii) CTAB-3, and (iv) CTAB-4. (b) Representative UV-Vis-NIR absorption spectra of CTAB-coated GNRs with four different aspect ratios. (c) UV-Vis-NIR absorption spectra of GNRs with CTAB, CTAB/PSS, CTAB/PAH, CTAB/PSS/PAH and CTAB/PAH/PSS coatings. (d) Zeta potentials of the GNRs with different coatings.

