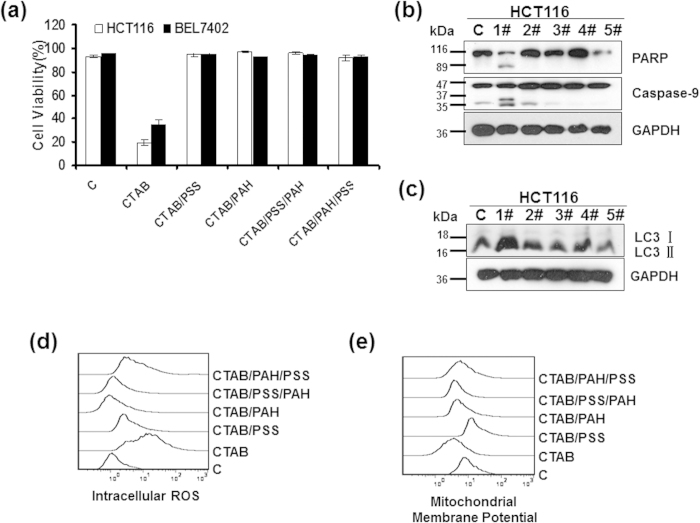
Figure 8. Cytotoxicity studies of cells treated with GNRs with different coatings.
Cells were treated with GNRs with different coatings (1# = CTAB, 2# = CTAB/PSS, 3# = CATB/PAH, 4# = CTAB/PSS/PAH, 5# = CTAB/PAH/PSS) at 2 nM for 24 h (b,d,e) or 72 h (a,c). (a) Cell viability was determined by trypan blue exclusion assays. Western blot analysis of the cell apoptosis marker PARP, caspase-9 (b) and the autophagy marker LC3 (c). Cropping lines are used in the figure. Full-length blots are presented in Supplementary Figure 6. The gels have been run under the same experimental conditions. Flow cytometry analysis of (d) intracellular ROS and (e) the mitochondrial membrane potential.

