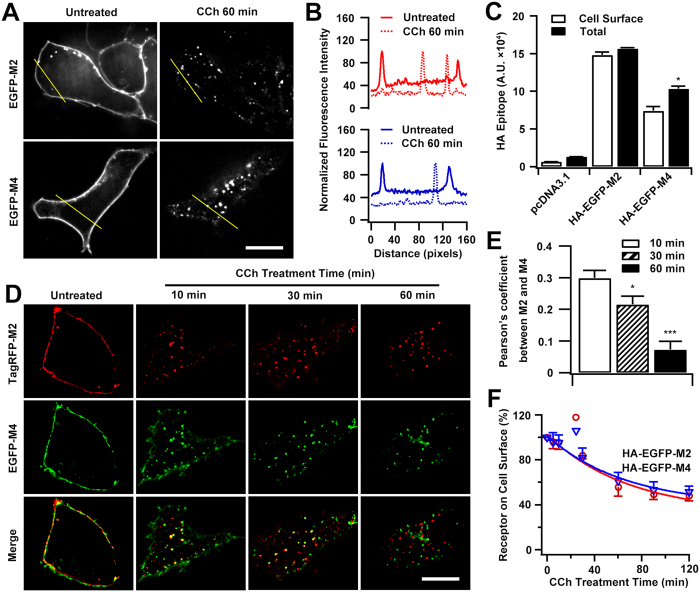
Figure 1. Time courses of CCh-stimulated internalization of M2 and M4 mAChRs.
(A) Representative live imaging of HEK293 cells expressing EGFP-M2 or EGFP-M4 before or after CCh treatment. Scale bar, 10 μm. (B) Linear profile analysis showed the plasma membrane-associated M2 or M4 signals were translocated inside of cells after CCh (100 μM) treatment for 60 min, as depicted in A. (C) Surface and total expression of mAChRs. HEK293 cells were transfected with HA-EGFP-M2 or HA-EGFP-M4 and measured by ELISA using a monoclonal anti-HA antibody, pcDNA3.1 was used as control. (D) Confocal micrographs of cells co-expressing TagRFP-M2 and EGFP-M4, in the absence or presence of CCh for the indicated time courses. Images representative of different conditions are shown from at least 15 cells visualized per condition and over three separate experiments. Scale bar, 10 μm. (E) The levels of colocalization between TagRFP-M2 and EGFP-M4 depicted in D were determined by Pearson’s coefficient as described in ′′Methods′′. (F) Time-dependency of CCh-induced internalization of M2 and M4 receptors. Internalization for cells expressing HA-EGFP-M2 or HA-EGFP-M4 was measured by ELISA. Shown is the percentage of residual surface receptors following agonist exposure for 5, 10, 30, 60, 90 or 120 min with respect to that at time point of 0. Mean ± SEM of at least three independent experiments is shown for each time points. The kinetics curves were generated by single exponential fitting. *p < 0.05, ***p < 0.001.

