
Figure 2. Mean, minimum and maximum of vessel noise (30 seconds with maximum energy) shown in octave bands superimposed on a harbour porpoise audiogram [red line; (adapted from 31)].
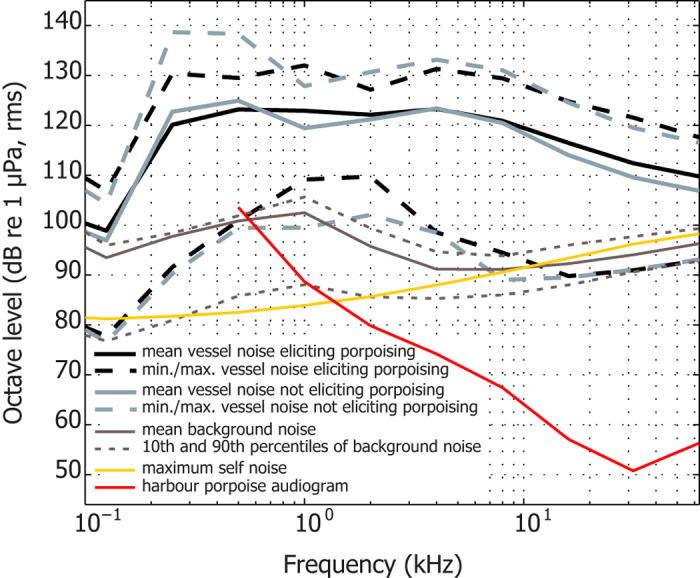
Noise evoking porpoising behaviour is indicated in black. Mean octave levels (solid) and 10th and 90th percentiles (dotted) of background noise are shown as grey lines. The maximum self-noise of the recording system is indicated by the yellow solid line.