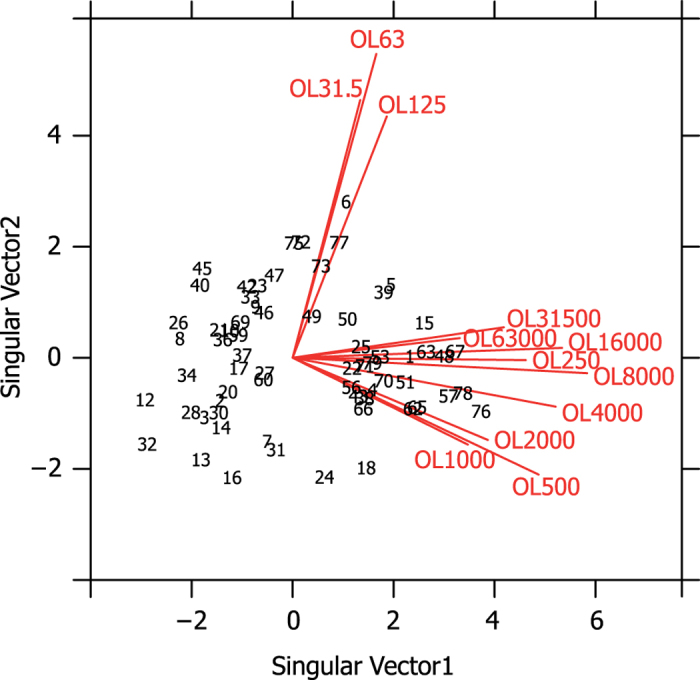
Figure 3. Biplot32 representing the correlation structure of the dataset in a two-dimensional space (see more details about this analysis in Methods section).

In the biplot, black numbers represent the observations and the red vectors represent the variables. Axes refer to the first two singular vectors of the singular value decomposition. Observation scores are in deviation from their average for each of these singular vectors (the values were centred by variable). Note the homogeneous distribution of observations with no groups or extreme values and the clear aggregation of vectors into two different groups: low-frequency bands (OL31.5, OL63 and OL125 Hz), and high-frequency bands (OL250–OL63000 Hz). OL = octave level.
