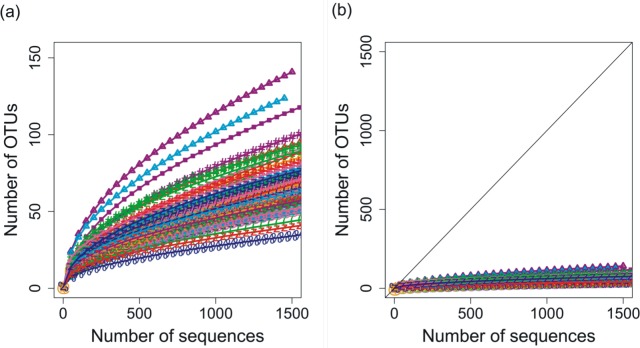
Figure 1. Rarefaction curves for phoH sequences from all 85 depths/times; OTUs are defined by sequence identity of 97% or greater.
(A) Plotting with different scales on x- and y-axes demonstrates some separation of the rarefaction curves. Curve with greatest slope is September 2008, 0 m, while curve with least slope is March 2011, 1,000 m. (B) Plotting in relation to the 1:1 line demonstrates flattening of all rarefaction curves.

