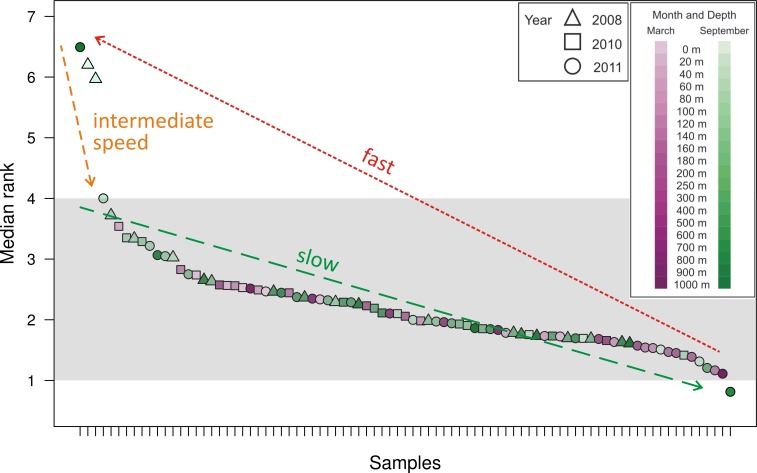
Figure 2. Median rank for each of the 85 communities sampled, arranged in descending order of median rank.
Each ⋅ represents a sample and the median rank can be interpreted as the number of abundant OTUs in that community. Shading emphasizes that most of the communities have a median rank between 1 and 4. The outlier on the right, with a median rank less than one, is hypothesized to represent a community during a kill-the-winner scenario which leads to communities of the type represented by the outliers to the left with median rank between 6 and 7. Assuming that such kill-the-winner cycles are present in all the communities, the density of points in a region should be characteristic of the rate at which the community dynamics move through that region.

