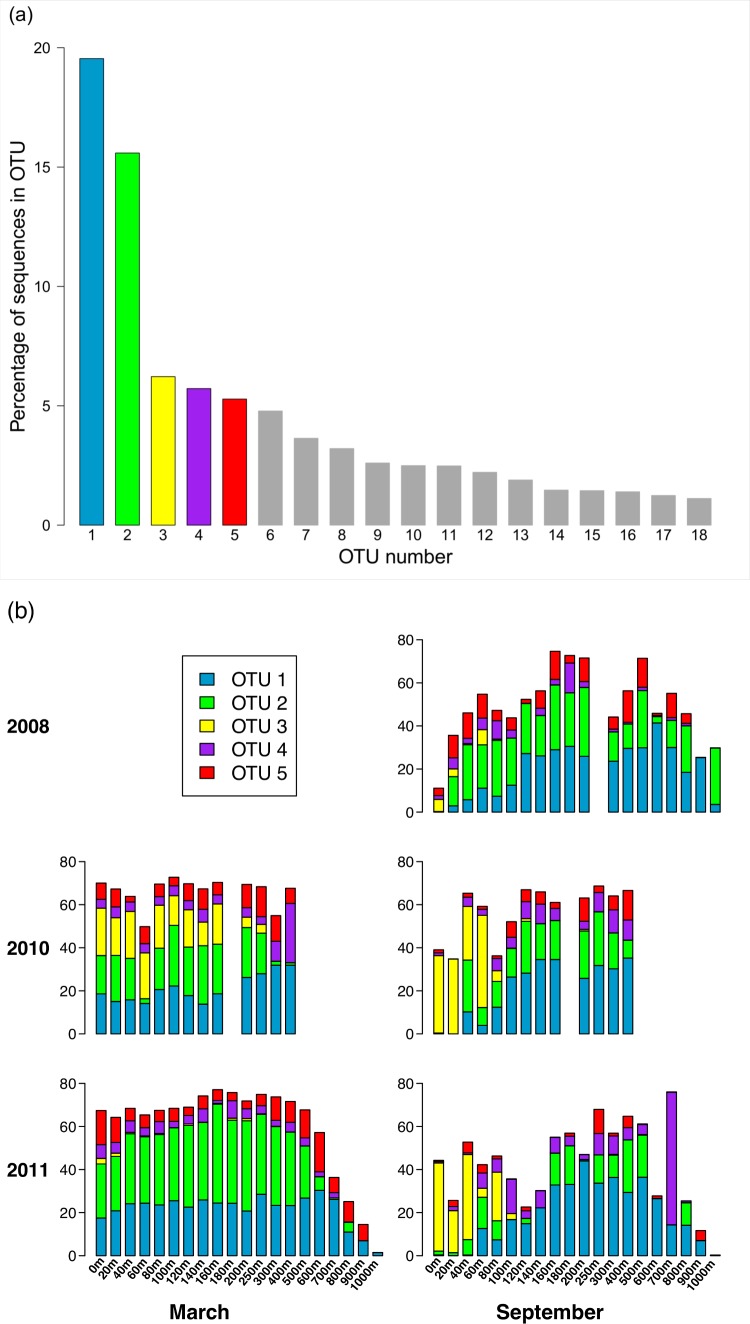
Figure 4. Composition of the phoH community according to the largest OTUs.
(A) Percent of total sequences belonging to the 18 OTUs that contain at least 1% of the total sequences (n = 313, 312). (B) Percent of each sample belonging to OTUs 1 through 5. An empty spot indicates absence of sample for that date/depth.

