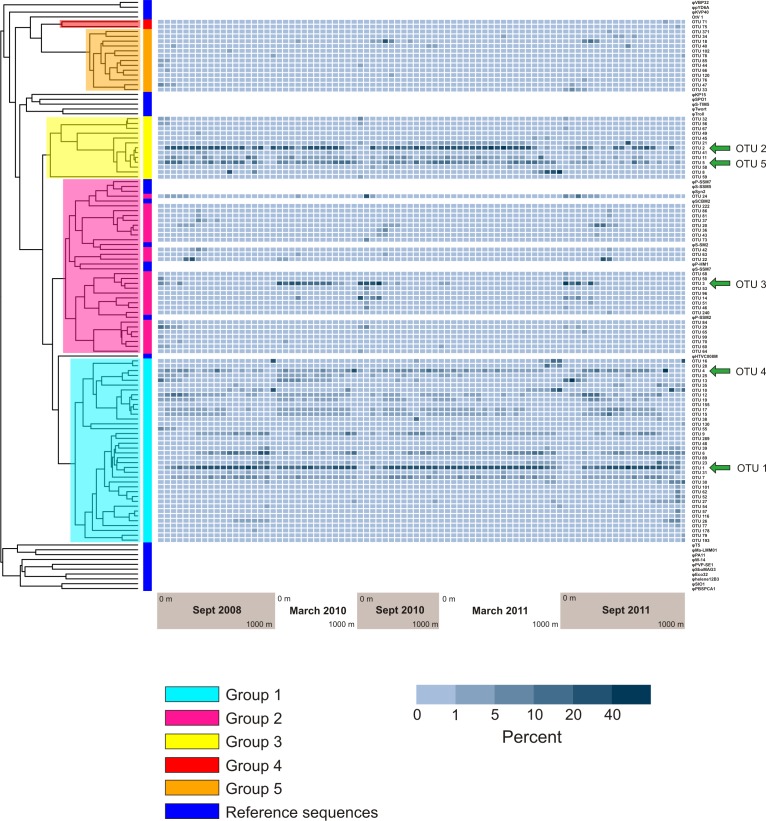
Figure 6. Prevalence of phylogenetically clustered OTUs in each sample, indicated as percent of each sample’s sequences that belong to each of the 94 top OTUs.
Reference phoH sequences from fully-sequenced phage genomes (and one eukaryotic virus) are indicated with dark blue in the vertical color bar along the left side of the heatmap, between the heatmap and tree. The phylogenetic Groups 1–5 indicated in the tree are the same groups designated in Goldsmith et al. (2011).

