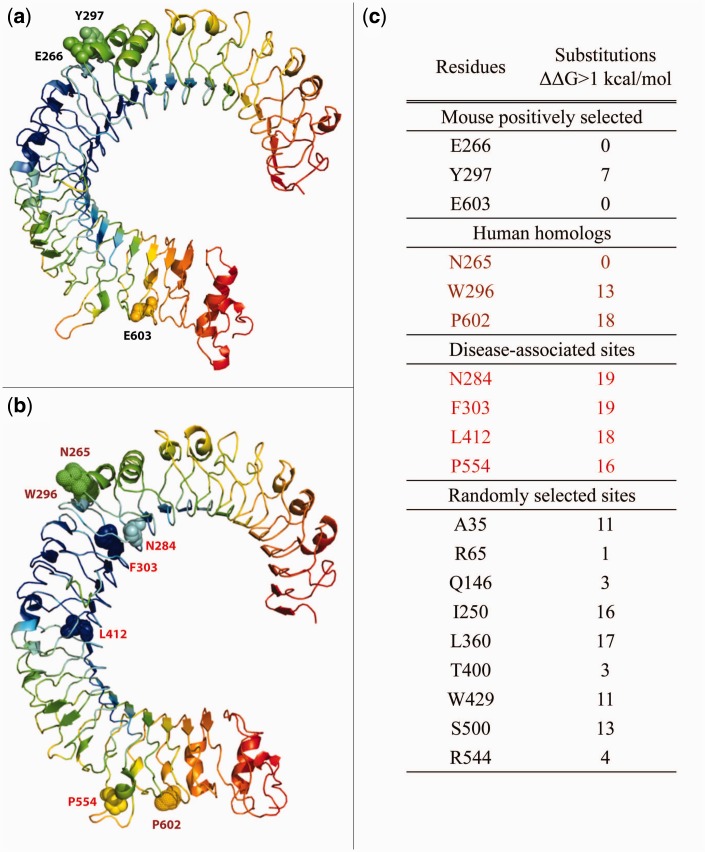
Fig. 3.
dfi of human TLR3 ectodomain. Ribbon diagrams of the crystal structure of the TLR3 ectodomain of (a) human (PDB id: 2A0Z) and (b) mouse (PDB id: 3CIG) colored with a spectrum of red–yellow–green–cyan–blue with respect to dfi. Red indicates the highest dfi values whereas blue indicates the lowest values. (c) The stability change for all possible substitutions was computed for: the positively selected sites in mouse (E266, Y297, and E603), their human homologs (N265, W296 and P602), known human disease-associated sites (N284, F303, L412, and P554; Stenson et al. 2003, and randomly selected sites. Except for the randomly selected sites, sites have been colored and indicated on the respective ribbon diagrams.

