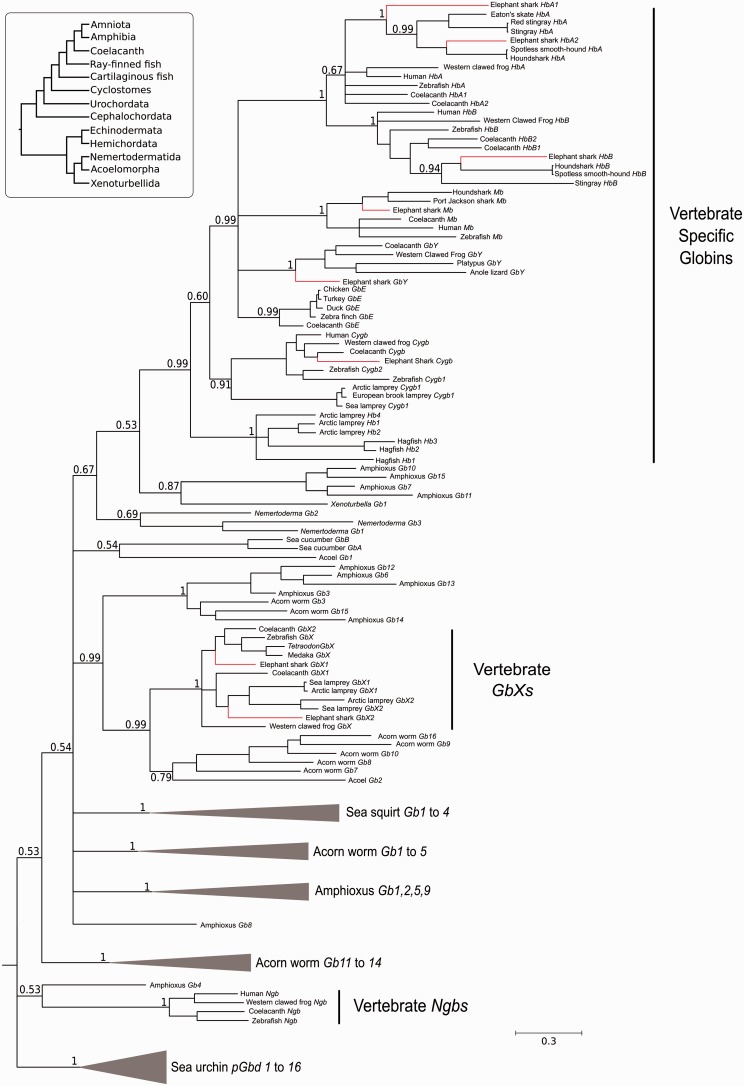
Fig. 1.
Bayesian phylogram depicting relationships among globin genes from representative deuterostome taxa. Numbers next to the nodes are Bayesian posterior probabilities. Terminal branches leading to elephant shark globins are shown in red. The tree was rooted by using plant globins as outgroup sequences (see Materials and Methods). The inset on top shows the organismal phylogeny for the representative deuterostome taxa included in the analysis.

