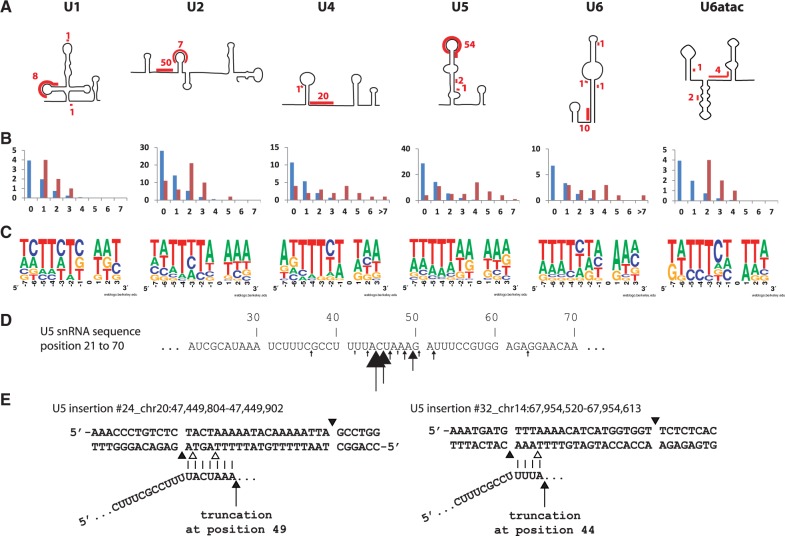
Fig. 3.
3′-truncated snRNA pseudogenes. (A) Schematic representation of snRNA secondary structures (based on Rinke et al. 1985 and Patel and Steitz 2003). Segment of sequences where truncation occurred and the number of occurrences are highlighted in red. (B) Distribution of the number of nucleotide homologies at the 3′-junction (Y-axis, number of occurrences; X-axis, number of nucleotides). The blue bars represent the expected random distribution, and red bars, the observed distribution. (C) Representation of the consensus cleavage site using WebLogo (Crooks et al. 2004). (D) Segment of the U5 snRNA where the majority of truncations occurred. Arrows are pointing truncation sites with size proportional to the occurrence of truncation events. (E) Two examples of U5 snRNA 3′-truncation. Vertical bars represent sequence homology between genomic DNA and U5. Black arrows indicate putative truncation points on the snRNA sequence. Black arrowheads delimitate the considered TSD. Empty arrowheads correspond to the L1 EN consensus cleavage sites potentially used by ORF2p to generate the first genomic DNA nick.

