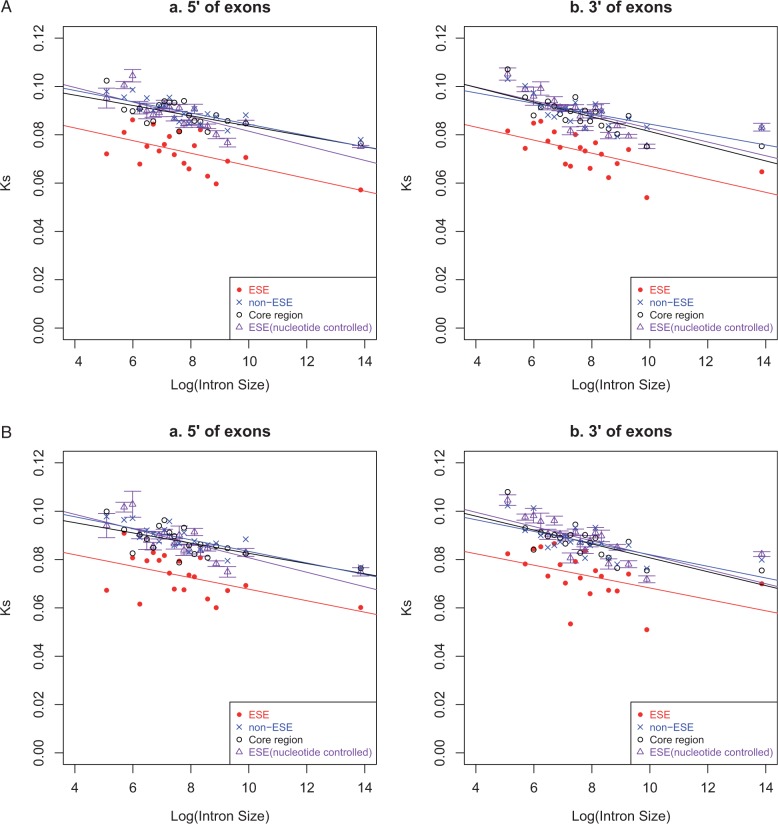
Fig. 1.
Rate of synonymous evolution in ESE and non-ESE sequences at exon ends as a function of the Log of flanking intron size for two ESE data sets (A: INT3, B: INT3_400). In addition to Ks of ESE and non-ESE we also show Ks of exon core domains and pseudo-ESE, that is, hexamers of the same underlying nucleotide content as ESEs but not necessarily identified as being functional ESE. We consider 20 intron size bins apportioned so that all bins contain the same number of exon ends for concatenation, the numbers given reflecting the upper intron size limit of each bin.

