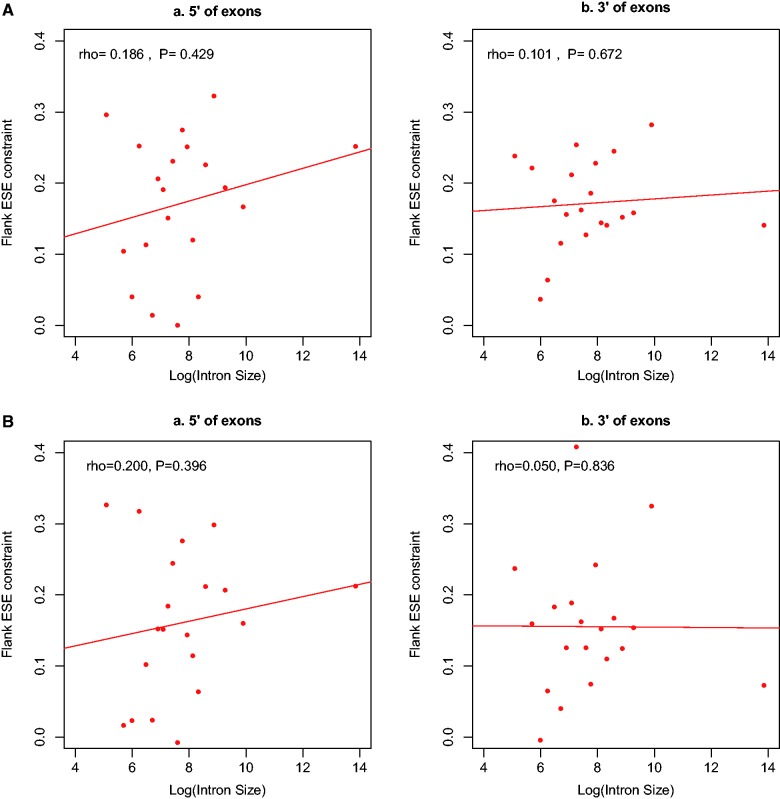
Fig. 2.
The degree of selective constraint on ESE sequences at exon ends as a function of the Log of flanking intron size for two ESE data sets (A: INT3, B: INT3_400). For definition of constraint, see main text. For intron size definition, see figure 1. Note that in all cases constraint appears stronger when intron sizes are larger, although using 20 bins the trends are not significant.

