
Fig. 2.
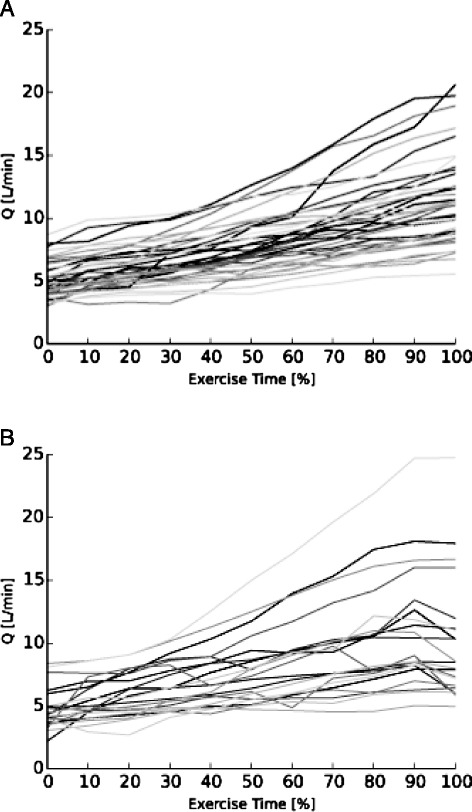
a: Individual cardiac output (Q) responses with an continuous increase during exercise (n =40) and b: individual cardiac output (Q) responses with a plateau or decrease during the final 10 % of exercise during a symptom limited exercise test (n =21)