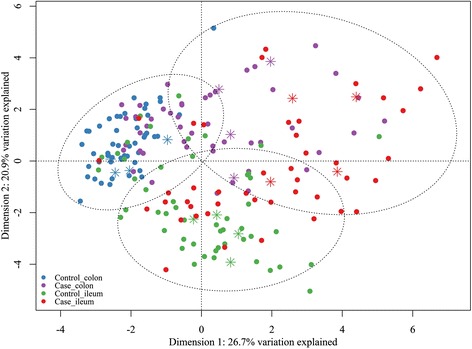
Figure 1.

PCA score plot of ileal and colonic content of piglets with (case) and without (control) NNPD. PCA scores are generated from normalized relative values of ileal and colonic content of case and control piglets obtained from the Gut Microbiotassay. Asterisks symbolize samples selected for 454 sequencing. Circles represent K-means clustering. For further information see Additional files 2 and 4.
